


Class 8 Exam > Class 8 Questions > The bar chart shows the number of workers emp... Start Learning for Free
The bar chart shows the number of workers employed by a trading company in three years.
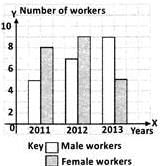
Calculate the difference between the total number of male and female workers employed over those three years.
- a)1
- b)2
- c)4
- d)6
Correct answer is option 'A'. Can you explain this answer?

Verified Answer
The bar chart shows the number of workers employed by a trading compan...
The total number of male workers employed = 5+7+9 = 21
The total number of female workers employed =8+9+5 = 22
∴ The required difference = 22−21 = 1
The total number of female workers employed =8+9+5 = 22
∴ The required difference = 22−21 = 1
 | Explore Courses for Class 8 exam |
Top Courses for Class 8View all


Top Courses for Class 8
Question Description
The bar chart shows the number of workers employed by a trading company in three years.Calculate the difference between the total number of male and female workers employed over those three years.a)1b)2c)4d)6Correct answer is option 'A'. Can you explain this answer? for Class 8 2026 is part of Class 8 preparation. The Question and answers have been prepared according to the Class 8 exam syllabus. Information about The bar chart shows the number of workers employed by a trading company in three years.Calculate the difference between the total number of male and female workers employed over those three years.a)1b)2c)4d)6Correct answer is option 'A'. Can you explain this answer? covers all topics & solutions for Class 8 2026 Exam. Find important definitions, questions, meanings, examples, exercises and tests below for The bar chart shows the number of workers employed by a trading company in three years.Calculate the difference between the total number of male and female workers employed over those three years.a)1b)2c)4d)6Correct answer is option 'A'. Can you explain this answer?.
The bar chart shows the number of workers employed by a trading company in three years.Calculate the difference between the total number of male and female workers employed over those three years.a)1b)2c)4d)6Correct answer is option 'A'. Can you explain this answer? for Class 8 2026 is part of Class 8 preparation. The Question and answers have been prepared according to the Class 8 exam syllabus. Information about The bar chart shows the number of workers employed by a trading company in three years.Calculate the difference between the total number of male and female workers employed over those three years.a)1b)2c)4d)6Correct answer is option 'A'. Can you explain this answer? covers all topics & solutions for Class 8 2026 Exam. Find important definitions, questions, meanings, examples, exercises and tests below for The bar chart shows the number of workers employed by a trading company in three years.Calculate the difference between the total number of male and female workers employed over those three years.a)1b)2c)4d)6Correct answer is option 'A'. Can you explain this answer?.
Solutions for The bar chart shows the number of workers employed by a trading company in three years.Calculate the difference between the total number of male and female workers employed over those three years.a)1b)2c)4d)6Correct answer is option 'A'. Can you explain this answer? in English & in Hindi are available as part of our courses for Class 8. Download more important topics, notes, lectures and mock test series for Class 8 Exam by signing up for free.
Here you can find the meaning of The bar chart shows the number of workers employed by a trading company in three years.Calculate the difference between the total number of male and female workers employed over those three years.a)1b)2c)4d)6Correct answer is option 'A'. Can you explain this answer? defined & explained in the simplest way possible. Besides giving the explanation of The bar chart shows the number of workers employed by a trading company in three years.Calculate the difference between the total number of male and female workers employed over those three years.a)1b)2c)4d)6Correct answer is option 'A'. Can you explain this answer?, a detailed solution for The bar chart shows the number of workers employed by a trading company in three years.Calculate the difference between the total number of male and female workers employed over those three years.a)1b)2c)4d)6Correct answer is option 'A'. Can you explain this answer? has been provided alongside types of The bar chart shows the number of workers employed by a trading company in three years.Calculate the difference between the total number of male and female workers employed over those three years.a)1b)2c)4d)6Correct answer is option 'A'. Can you explain this answer? theory, EduRev gives you an ample number of questions to practice The bar chart shows the number of workers employed by a trading company in three years.Calculate the difference between the total number of male and female workers employed over those three years.a)1b)2c)4d)6Correct answer is option 'A'. Can you explain this answer? tests, examples and also practice Class 8 tests.
| Explore Courses for Class 8 exam |
Top Courses for Class 8
Explore Courses
Signup for Free!
Signup to see your scores go up within 7 days! Learn & Practice with 1000+ FREE Notes, Videos & Tests.


