


Class 11 Exam > Class 11 Questions > A thin rod of length L is lying along the x-a... Start Learning for Free
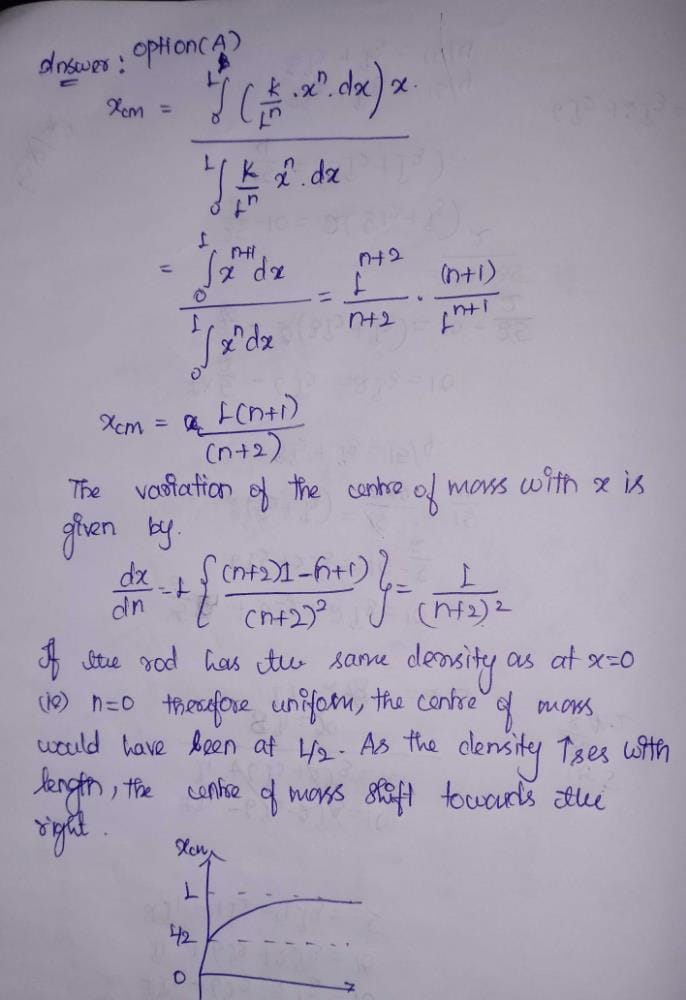
A thin rod of length L is lying along the x-axis with its ends at x = 0 and x = L. Its linear density (mass/length) varies with x as  where n can be zero or any positive number. If the position
  of the centre of mass of the rod is plotted against n, which of the following graphs best approximates the dependence of
  on n?
on n?
where n can be zero or any positive number. If the position of the centre of mass of the rod is plotted against n, which of the following graphs best approximates the dependence of on n? [AIEEE 2008]
- a)

- b)

- c)

- d)

Correct answer is option 'A'. Can you explain this answer?

Most Upvoted Answer
A thin rod of length L is lying along the x-axis with its ends at x = ...
 | Explore Courses for Class 11 exam |
Top Courses for Class 11View all


Top Courses for Class 11
Question Description
A thin rod of length L is lying along the x-axis with its ends at x = 0 and x = L. Its linear density (mass/length) varies with x aswhere n can be zero or any positive number. If the positionof the centre of mass of the rod is plotted against n, which of the following graphs best approximates the dependence ofon n?[AIEEE 2008]a)b)c)d)Correct answer is option 'A'. Can you explain this answer? for Class 11 2026 is part of Class 11 preparation. The Question and answers have been prepared according to the Class 11 exam syllabus. Information about A thin rod of length L is lying along the x-axis with its ends at x = 0 and x = L. Its linear density (mass/length) varies with x aswhere n can be zero or any positive number. If the positionof the centre of mass of the rod is plotted against n, which of the following graphs best approximates the dependence ofon n?[AIEEE 2008]a)b)c)d)Correct answer is option 'A'. Can you explain this answer? covers all topics & solutions for Class 11 2026 Exam. Find important definitions, questions, meanings, examples, exercises and tests below for A thin rod of length L is lying along the x-axis with its ends at x = 0 and x = L. Its linear density (mass/length) varies with x aswhere n can be zero or any positive number. If the positionof the centre of mass of the rod is plotted against n, which of the following graphs best approximates the dependence ofon n?[AIEEE 2008]a)b)c)d)Correct answer is option 'A'. Can you explain this answer?.
A thin rod of length L is lying along the x-axis with its ends at x = 0 and x = L. Its linear density (mass/length) varies with x aswhere n can be zero or any positive number. If the positionof the centre of mass of the rod is plotted against n, which of the following graphs best approximates the dependence ofon n?[AIEEE 2008]a)b)c)d)Correct answer is option 'A'. Can you explain this answer? for Class 11 2026 is part of Class 11 preparation. The Question and answers have been prepared according to the Class 11 exam syllabus. Information about A thin rod of length L is lying along the x-axis with its ends at x = 0 and x = L. Its linear density (mass/length) varies with x aswhere n can be zero or any positive number. If the positionof the centre of mass of the rod is plotted against n, which of the following graphs best approximates the dependence ofon n?[AIEEE 2008]a)b)c)d)Correct answer is option 'A'. Can you explain this answer? covers all topics & solutions for Class 11 2026 Exam. Find important definitions, questions, meanings, examples, exercises and tests below for A thin rod of length L is lying along the x-axis with its ends at x = 0 and x = L. Its linear density (mass/length) varies with x aswhere n can be zero or any positive number. If the positionof the centre of mass of the rod is plotted against n, which of the following graphs best approximates the dependence ofon n?[AIEEE 2008]a)b)c)d)Correct answer is option 'A'. Can you explain this answer?.
Solutions for A thin rod of length L is lying along the x-axis with its ends at x = 0 and x = L. Its linear density (mass/length) varies with x aswhere n can be zero or any positive number. If the positionof the centre of mass of the rod is plotted against n, which of the following graphs best approximates the dependence ofon n?[AIEEE 2008]a)b)c)d)Correct answer is option 'A'. Can you explain this answer? in English & in Hindi are available as part of our courses for Class 11. Download more important topics, notes, lectures and mock test series for Class 11 Exam by signing up for free.
Here you can find the meaning of A thin rod of length L is lying along the x-axis with its ends at x = 0 and x = L. Its linear density (mass/length) varies with x aswhere n can be zero or any positive number. If the positionof the centre of mass of the rod is plotted against n, which of the following graphs best approximates the dependence ofon n?[AIEEE 2008]a)b)c)d)Correct answer is option 'A'. Can you explain this answer? defined & explained in the simplest way possible. Besides giving the explanation of A thin rod of length L is lying along the x-axis with its ends at x = 0 and x = L. Its linear density (mass/length) varies with x aswhere n can be zero or any positive number. If the positionof the centre of mass of the rod is plotted against n, which of the following graphs best approximates the dependence ofon n?[AIEEE 2008]a)b)c)d)Correct answer is option 'A'. Can you explain this answer?, a detailed solution for A thin rod of length L is lying along the x-axis with its ends at x = 0 and x = L. Its linear density (mass/length) varies with x aswhere n can be zero or any positive number. If the positionof the centre of mass of the rod is plotted against n, which of the following graphs best approximates the dependence ofon n?[AIEEE 2008]a)b)c)d)Correct answer is option 'A'. Can you explain this answer? has been provided alongside types of A thin rod of length L is lying along the x-axis with its ends at x = 0 and x = L. Its linear density (mass/length) varies with x aswhere n can be zero or any positive number. If the positionof the centre of mass of the rod is plotted against n, which of the following graphs best approximates the dependence ofon n?[AIEEE 2008]a)b)c)d)Correct answer is option 'A'. Can you explain this answer? theory, EduRev gives you an ample number of questions to practice A thin rod of length L is lying along the x-axis with its ends at x = 0 and x = L. Its linear density (mass/length) varies with x aswhere n can be zero or any positive number. If the positionof the centre of mass of the rod is plotted against n, which of the following graphs best approximates the dependence ofon n?[AIEEE 2008]a)b)c)d)Correct answer is option 'A'. Can you explain this answer? tests, examples and also practice Class 11 tests.
| Explore Courses for Class 11 exam |
Top Courses for Class 11
Explore Courses
Signup for Free!
Signup to see your scores go up within 7 days! Learn & Practice with 1000+ FREE Notes, Videos & Tests.


