


LR Exam > LR Questions > Practice Quiz or MCQ (Multiple Choice Questio... Start Learning for Free
Practice Quiz or MCQ (Multiple Choice Questions) with solutions are available for Practice, which would help you prepare for "Line Charts" under LR and DI. You can practice these practice quizzes as per your speed and improvise the topic. The same topic is covered under various competitive examinations like - CAT, GMAT, Bank PO, SSC and other competitive examinations.
Q.
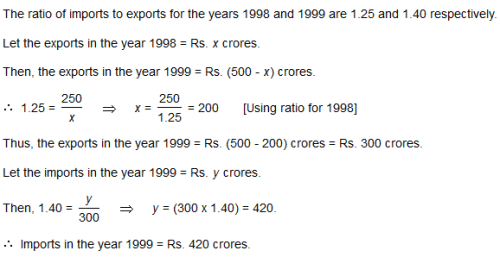
The following line graph gives the ratio of the amounts of imports by a company to the amount of exports from that company over the period from 1995 to 2001.
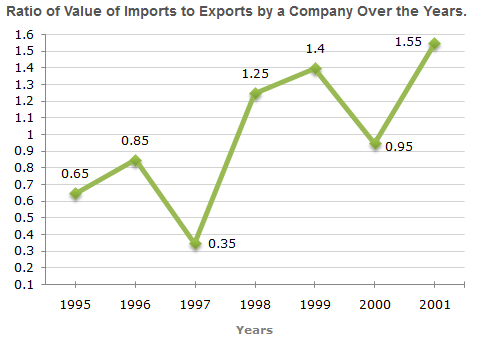
If the imports in 1998 was Rs. 250 crores and the total exports in the years 1998 and 1999 together was Rs. 500 crores, then the imports in 1999 was ?
- a)Rs. 250 crores
- b)Rs. 300 crores
- c)Rs. 357 crores
- d)Rs. 420 crores
Correct answer is option 'D'. Can you explain this answer?

Verified Answer
Practice Quiz or MCQ (Multiple Choice Questions) with solutions are av...
 | Explore Courses for LR exam |
Top Courses for LRView all


Top Courses for LR
Question Description
Practice Quiz or MCQ (Multiple Choice Questions) with solutions are available for Practice, which would help you prepare for "Line Charts" under LR and DI. You can practice these practice quizzes as per your speed and improvise the topic. The same topic is covered under various competitive examinations like - CAT, GMAT, Bank PO, SSC and other competitive examinations.Q.The following line graph gives the ratio of the amounts of imports by a company to the amount of exports from that company over the period from 1995 to 2001.If the imports in 1998 was Rs. 250 crores and the total exports in the years 1998 and 1999 together was Rs. 500 crores, then the imports in 1999 was ?a)Rs. 250 croresb)Rs. 300 croresc)Rs. 357 croresd)Rs. 420 croresCorrect answer is option 'D'. Can you explain this answer? for LR 2026 is part of LR preparation. The Question and answers have been prepared according to the LR exam syllabus. Information about Practice Quiz or MCQ (Multiple Choice Questions) with solutions are available for Practice, which would help you prepare for "Line Charts" under LR and DI. You can practice these practice quizzes as per your speed and improvise the topic. The same topic is covered under various competitive examinations like - CAT, GMAT, Bank PO, SSC and other competitive examinations.Q.The following line graph gives the ratio of the amounts of imports by a company to the amount of exports from that company over the period from 1995 to 2001.If the imports in 1998 was Rs. 250 crores and the total exports in the years 1998 and 1999 together was Rs. 500 crores, then the imports in 1999 was ?a)Rs. 250 croresb)Rs. 300 croresc)Rs. 357 croresd)Rs. 420 croresCorrect answer is option 'D'. Can you explain this answer? covers all topics & solutions for LR 2026 Exam. Find important definitions, questions, meanings, examples, exercises and tests below for Practice Quiz or MCQ (Multiple Choice Questions) with solutions are available for Practice, which would help you prepare for "Line Charts" under LR and DI. You can practice these practice quizzes as per your speed and improvise the topic. The same topic is covered under various competitive examinations like - CAT, GMAT, Bank PO, SSC and other competitive examinations.Q.The following line graph gives the ratio of the amounts of imports by a company to the amount of exports from that company over the period from 1995 to 2001.If the imports in 1998 was Rs. 250 crores and the total exports in the years 1998 and 1999 together was Rs. 500 crores, then the imports in 1999 was ?a)Rs. 250 croresb)Rs. 300 croresc)Rs. 357 croresd)Rs. 420 croresCorrect answer is option 'D'. Can you explain this answer?.
Practice Quiz or MCQ (Multiple Choice Questions) with solutions are available for Practice, which would help you prepare for "Line Charts" under LR and DI. You can practice these practice quizzes as per your speed and improvise the topic. The same topic is covered under various competitive examinations like - CAT, GMAT, Bank PO, SSC and other competitive examinations.Q.The following line graph gives the ratio of the amounts of imports by a company to the amount of exports from that company over the period from 1995 to 2001.If the imports in 1998 was Rs. 250 crores and the total exports in the years 1998 and 1999 together was Rs. 500 crores, then the imports in 1999 was ?a)Rs. 250 croresb)Rs. 300 croresc)Rs. 357 croresd)Rs. 420 croresCorrect answer is option 'D'. Can you explain this answer? for LR 2026 is part of LR preparation. The Question and answers have been prepared according to the LR exam syllabus. Information about Practice Quiz or MCQ (Multiple Choice Questions) with solutions are available for Practice, which would help you prepare for "Line Charts" under LR and DI. You can practice these practice quizzes as per your speed and improvise the topic. The same topic is covered under various competitive examinations like - CAT, GMAT, Bank PO, SSC and other competitive examinations.Q.The following line graph gives the ratio of the amounts of imports by a company to the amount of exports from that company over the period from 1995 to 2001.If the imports in 1998 was Rs. 250 crores and the total exports in the years 1998 and 1999 together was Rs. 500 crores, then the imports in 1999 was ?a)Rs. 250 croresb)Rs. 300 croresc)Rs. 357 croresd)Rs. 420 croresCorrect answer is option 'D'. Can you explain this answer? covers all topics & solutions for LR 2026 Exam. Find important definitions, questions, meanings, examples, exercises and tests below for Practice Quiz or MCQ (Multiple Choice Questions) with solutions are available for Practice, which would help you prepare for "Line Charts" under LR and DI. You can practice these practice quizzes as per your speed and improvise the topic. The same topic is covered under various competitive examinations like - CAT, GMAT, Bank PO, SSC and other competitive examinations.Q.The following line graph gives the ratio of the amounts of imports by a company to the amount of exports from that company over the period from 1995 to 2001.If the imports in 1998 was Rs. 250 crores and the total exports in the years 1998 and 1999 together was Rs. 500 crores, then the imports in 1999 was ?a)Rs. 250 croresb)Rs. 300 croresc)Rs. 357 croresd)Rs. 420 croresCorrect answer is option 'D'. Can you explain this answer?.
Solutions for Practice Quiz or MCQ (Multiple Choice Questions) with solutions are available for Practice, which would help you prepare for "Line Charts" under LR and DI. You can practice these practice quizzes as per your speed and improvise the topic. The same topic is covered under various competitive examinations like - CAT, GMAT, Bank PO, SSC and other competitive examinations.Q.The following line graph gives the ratio of the amounts of imports by a company to the amount of exports from that company over the period from 1995 to 2001.If the imports in 1998 was Rs. 250 crores and the total exports in the years 1998 and 1999 together was Rs. 500 crores, then the imports in 1999 was ?a)Rs. 250 croresb)Rs. 300 croresc)Rs. 357 croresd)Rs. 420 croresCorrect answer is option 'D'. Can you explain this answer? in English & in Hindi are available as part of our courses for LR. Download more important topics, notes, lectures and mock test series for LR Exam by signing up for free.
Here you can find the meaning of Practice Quiz or MCQ (Multiple Choice Questions) with solutions are available for Practice, which would help you prepare for "Line Charts" under LR and DI. You can practice these practice quizzes as per your speed and improvise the topic. The same topic is covered under various competitive examinations like - CAT, GMAT, Bank PO, SSC and other competitive examinations.Q.The following line graph gives the ratio of the amounts of imports by a company to the amount of exports from that company over the period from 1995 to 2001.If the imports in 1998 was Rs. 250 crores and the total exports in the years 1998 and 1999 together was Rs. 500 crores, then the imports in 1999 was ?a)Rs. 250 croresb)Rs. 300 croresc)Rs. 357 croresd)Rs. 420 croresCorrect answer is option 'D'. Can you explain this answer? defined & explained in the simplest way possible. Besides giving the explanation of Practice Quiz or MCQ (Multiple Choice Questions) with solutions are available for Practice, which would help you prepare for "Line Charts" under LR and DI. You can practice these practice quizzes as per your speed and improvise the topic. The same topic is covered under various competitive examinations like - CAT, GMAT, Bank PO, SSC and other competitive examinations.Q.The following line graph gives the ratio of the amounts of imports by a company to the amount of exports from that company over the period from 1995 to 2001.If the imports in 1998 was Rs. 250 crores and the total exports in the years 1998 and 1999 together was Rs. 500 crores, then the imports in 1999 was ?a)Rs. 250 croresb)Rs. 300 croresc)Rs. 357 croresd)Rs. 420 croresCorrect answer is option 'D'. Can you explain this answer?, a detailed solution for Practice Quiz or MCQ (Multiple Choice Questions) with solutions are available for Practice, which would help you prepare for "Line Charts" under LR and DI. You can practice these practice quizzes as per your speed and improvise the topic. The same topic is covered under various competitive examinations like - CAT, GMAT, Bank PO, SSC and other competitive examinations.Q.The following line graph gives the ratio of the amounts of imports by a company to the amount of exports from that company over the period from 1995 to 2001.If the imports in 1998 was Rs. 250 crores and the total exports in the years 1998 and 1999 together was Rs. 500 crores, then the imports in 1999 was ?a)Rs. 250 croresb)Rs. 300 croresc)Rs. 357 croresd)Rs. 420 croresCorrect answer is option 'D'. Can you explain this answer? has been provided alongside types of Practice Quiz or MCQ (Multiple Choice Questions) with solutions are available for Practice, which would help you prepare for "Line Charts" under LR and DI. You can practice these practice quizzes as per your speed and improvise the topic. The same topic is covered under various competitive examinations like - CAT, GMAT, Bank PO, SSC and other competitive examinations.Q.The following line graph gives the ratio of the amounts of imports by a company to the amount of exports from that company over the period from 1995 to 2001.If the imports in 1998 was Rs. 250 crores and the total exports in the years 1998 and 1999 together was Rs. 500 crores, then the imports in 1999 was ?a)Rs. 250 croresb)Rs. 300 croresc)Rs. 357 croresd)Rs. 420 croresCorrect answer is option 'D'. Can you explain this answer? theory, EduRev gives you an ample number of questions to practice Practice Quiz or MCQ (Multiple Choice Questions) with solutions are available for Practice, which would help you prepare for "Line Charts" under LR and DI. You can practice these practice quizzes as per your speed and improvise the topic. The same topic is covered under various competitive examinations like - CAT, GMAT, Bank PO, SSC and other competitive examinations.Q.The following line graph gives the ratio of the amounts of imports by a company to the amount of exports from that company over the period from 1995 to 2001.If the imports in 1998 was Rs. 250 crores and the total exports in the years 1998 and 1999 together was Rs. 500 crores, then the imports in 1999 was ?a)Rs. 250 croresb)Rs. 300 croresc)Rs. 357 croresd)Rs. 420 croresCorrect answer is option 'D'. Can you explain this answer? tests, examples and also practice LR tests.
| Explore Courses for LR exam |
Top Courses for LR
Explore Courses
Signup for Free!
Signup to see your scores go up within 7 days! Learn & Practice with 1000+ FREE Notes, Videos & Tests.


