


JEE Exam > JEE Questions > Sketch shows the plot of Z v/s P for of a hyp...
Start Learning for Free

Sketch shows the plot of Z v/s P for of a hypothetical gas for one mole at three distinct temperature.
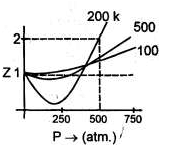
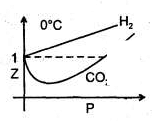
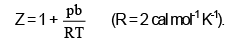
Boyle’s temperature is the temperature at which a gas shows ideal behaviour over a pressure range in the low pressure region. Boyle's temperature (Tb) = a/Rb . If a plot is obtained at temperatures well below Boyle's temperature then the curve will show negative deviation, in low pressure region and positive deviation in the high pressure region. Near critical temperature the curve is more likely as CO2 and the temperature well above critical temperature curve is more like H2 at 0°C as shown above. At high pressure suppose all the constant temperature curve varies linearly with pressure according to the following equation:
Q.
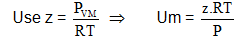
As shown in the figure at 200 K and 500 atm value of compressibility factor is 2 (approx). Then volume of the gas at this point will be
- a)0.01 L
- b)0.09 L
- c)0.065 L
- d)0.657 L
Correct answer is option 'C'. Can you explain this answer?
| FREE This question is part of | Download PDF Attempt this Test |
Verified Answer
Sketch shows the plot of Z v/s P for of a hypothetical gas for one mol...

|
Explore Courses for JEE exam
|
|
Top Courses for JEEView all


Sketch shows the plot of Z v/s P for of a hypothetical gas for one mole at three distinct temperature.Boyles temperature is the temperature at which a gas shows ideal behaviour over a pressure range in the low pressure region. Boyles temperature (Tb) = a/Rb . If a plot is obtained at temperatures well below Boyles temperature then the curve will show negative deviation, in low pressure region and positive deviation in the high pressure region. Near critical temperature the curve is more likely as CO2 and the temperature well above critical temperature curve is more like H2 at 0C as shown above. At high pressure suppose all the constant temperature curve varies linearly with pressure according to the following equation:Q.As shown in the figure at 200 K and 500 atm value of compressibility factor is 2 (approx). Then volume of the gas at this point will bea)0.01 Lb)0.09 Lc)0.065 Ld)0.657 LCorrect answer is option 'C'. Can you explain this answer?
Question Description
Sketch shows the plot of Z v/s P for of a hypothetical gas for one mole at three distinct temperature.Boyles temperature is the temperature at which a gas shows ideal behaviour over a pressure range in the low pressure region. Boyles temperature (Tb) = a/Rb . If a plot is obtained at temperatures well below Boyles temperature then the curve will show negative deviation, in low pressure region and positive deviation in the high pressure region. Near critical temperature the curve is more likely as CO2 and the temperature well above critical temperature curve is more like H2 at 0C as shown above. At high pressure suppose all the constant temperature curve varies linearly with pressure according to the following equation:Q.As shown in the figure at 200 K and 500 atm value of compressibility factor is 2 (approx). Then volume of the gas at this point will bea)0.01 Lb)0.09 Lc)0.065 Ld)0.657 LCorrect answer is option 'C'. Can you explain this answer? for JEE 2024 is part of JEE preparation. The Question and answers have been prepared according to the JEE exam syllabus. Information about Sketch shows the plot of Z v/s P for of a hypothetical gas for one mole at three distinct temperature.Boyles temperature is the temperature at which a gas shows ideal behaviour over a pressure range in the low pressure region. Boyles temperature (Tb) = a/Rb . If a plot is obtained at temperatures well below Boyles temperature then the curve will show negative deviation, in low pressure region and positive deviation in the high pressure region. Near critical temperature the curve is more likely as CO2 and the temperature well above critical temperature curve is more like H2 at 0C as shown above. At high pressure suppose all the constant temperature curve varies linearly with pressure according to the following equation:Q.As shown in the figure at 200 K and 500 atm value of compressibility factor is 2 (approx). Then volume of the gas at this point will bea)0.01 Lb)0.09 Lc)0.065 Ld)0.657 LCorrect answer is option 'C'. Can you explain this answer? covers all topics & solutions for JEE 2024 Exam. Find important definitions, questions, meanings, examples, exercises and tests below for Sketch shows the plot of Z v/s P for of a hypothetical gas for one mole at three distinct temperature.Boyles temperature is the temperature at which a gas shows ideal behaviour over a pressure range in the low pressure region. Boyles temperature (Tb) = a/Rb . If a plot is obtained at temperatures well below Boyles temperature then the curve will show negative deviation, in low pressure region and positive deviation in the high pressure region. Near critical temperature the curve is more likely as CO2 and the temperature well above critical temperature curve is more like H2 at 0C as shown above. At high pressure suppose all the constant temperature curve varies linearly with pressure according to the following equation:Q.As shown in the figure at 200 K and 500 atm value of compressibility factor is 2 (approx). Then volume of the gas at this point will bea)0.01 Lb)0.09 Lc)0.065 Ld)0.657 LCorrect answer is option 'C'. Can you explain this answer?.
Sketch shows the plot of Z v/s P for of a hypothetical gas for one mole at three distinct temperature.Boyles temperature is the temperature at which a gas shows ideal behaviour over a pressure range in the low pressure region. Boyles temperature (Tb) = a/Rb . If a plot is obtained at temperatures well below Boyles temperature then the curve will show negative deviation, in low pressure region and positive deviation in the high pressure region. Near critical temperature the curve is more likely as CO2 and the temperature well above critical temperature curve is more like H2 at 0C as shown above. At high pressure suppose all the constant temperature curve varies linearly with pressure according to the following equation:Q.As shown in the figure at 200 K and 500 atm value of compressibility factor is 2 (approx). Then volume of the gas at this point will bea)0.01 Lb)0.09 Lc)0.065 Ld)0.657 LCorrect answer is option 'C'. Can you explain this answer? for JEE 2024 is part of JEE preparation. The Question and answers have been prepared according to the JEE exam syllabus. Information about Sketch shows the plot of Z v/s P for of a hypothetical gas for one mole at three distinct temperature.Boyles temperature is the temperature at which a gas shows ideal behaviour over a pressure range in the low pressure region. Boyles temperature (Tb) = a/Rb . If a plot is obtained at temperatures well below Boyles temperature then the curve will show negative deviation, in low pressure region and positive deviation in the high pressure region. Near critical temperature the curve is more likely as CO2 and the temperature well above critical temperature curve is more like H2 at 0C as shown above. At high pressure suppose all the constant temperature curve varies linearly with pressure according to the following equation:Q.As shown in the figure at 200 K and 500 atm value of compressibility factor is 2 (approx). Then volume of the gas at this point will bea)0.01 Lb)0.09 Lc)0.065 Ld)0.657 LCorrect answer is option 'C'. Can you explain this answer? covers all topics & solutions for JEE 2024 Exam. Find important definitions, questions, meanings, examples, exercises and tests below for Sketch shows the plot of Z v/s P for of a hypothetical gas for one mole at three distinct temperature.Boyles temperature is the temperature at which a gas shows ideal behaviour over a pressure range in the low pressure region. Boyles temperature (Tb) = a/Rb . If a plot is obtained at temperatures well below Boyles temperature then the curve will show negative deviation, in low pressure region and positive deviation in the high pressure region. Near critical temperature the curve is more likely as CO2 and the temperature well above critical temperature curve is more like H2 at 0C as shown above. At high pressure suppose all the constant temperature curve varies linearly with pressure according to the following equation:Q.As shown in the figure at 200 K and 500 atm value of compressibility factor is 2 (approx). Then volume of the gas at this point will bea)0.01 Lb)0.09 Lc)0.065 Ld)0.657 LCorrect answer is option 'C'. Can you explain this answer?.
Solutions for Sketch shows the plot of Z v/s P for of a hypothetical gas for one mole at three distinct temperature.Boyles temperature is the temperature at which a gas shows ideal behaviour over a pressure range in the low pressure region. Boyles temperature (Tb) = a/Rb . If a plot is obtained at temperatures well below Boyles temperature then the curve will show negative deviation, in low pressure region and positive deviation in the high pressure region. Near critical temperature the curve is more likely as CO2 and the temperature well above critical temperature curve is more like H2 at 0C as shown above. At high pressure suppose all the constant temperature curve varies linearly with pressure according to the following equation:Q.As shown in the figure at 200 K and 500 atm value of compressibility factor is 2 (approx). Then volume of the gas at this point will bea)0.01 Lb)0.09 Lc)0.065 Ld)0.657 LCorrect answer is option 'C'. Can you explain this answer? in English & in Hindi are available as part of our courses for JEE.
Download more important topics, notes, lectures and mock test series for JEE Exam by signing up for free.
Here you can find the meaning of Sketch shows the plot of Z v/s P for of a hypothetical gas for one mole at three distinct temperature.Boyles temperature is the temperature at which a gas shows ideal behaviour over a pressure range in the low pressure region. Boyles temperature (Tb) = a/Rb . If a plot is obtained at temperatures well below Boyles temperature then the curve will show negative deviation, in low pressure region and positive deviation in the high pressure region. Near critical temperature the curve is more likely as CO2 and the temperature well above critical temperature curve is more like H2 at 0C as shown above. At high pressure suppose all the constant temperature curve varies linearly with pressure according to the following equation:Q.As shown in the figure at 200 K and 500 atm value of compressibility factor is 2 (approx). Then volume of the gas at this point will bea)0.01 Lb)0.09 Lc)0.065 Ld)0.657 LCorrect answer is option 'C'. Can you explain this answer? defined & explained in the simplest way possible. Besides giving the explanation of
Sketch shows the plot of Z v/s P for of a hypothetical gas for one mole at three distinct temperature.Boyles temperature is the temperature at which a gas shows ideal behaviour over a pressure range in the low pressure region. Boyles temperature (Tb) = a/Rb . If a plot is obtained at temperatures well below Boyles temperature then the curve will show negative deviation, in low pressure region and positive deviation in the high pressure region. Near critical temperature the curve is more likely as CO2 and the temperature well above critical temperature curve is more like H2 at 0C as shown above. At high pressure suppose all the constant temperature curve varies linearly with pressure according to the following equation:Q.As shown in the figure at 200 K and 500 atm value of compressibility factor is 2 (approx). Then volume of the gas at this point will bea)0.01 Lb)0.09 Lc)0.065 Ld)0.657 LCorrect answer is option 'C'. Can you explain this answer?, a detailed solution for Sketch shows the plot of Z v/s P for of a hypothetical gas for one mole at three distinct temperature.Boyles temperature is the temperature at which a gas shows ideal behaviour over a pressure range in the low pressure region. Boyles temperature (Tb) = a/Rb . If a plot is obtained at temperatures well below Boyles temperature then the curve will show negative deviation, in low pressure region and positive deviation in the high pressure region. Near critical temperature the curve is more likely as CO2 and the temperature well above critical temperature curve is more like H2 at 0C as shown above. At high pressure suppose all the constant temperature curve varies linearly with pressure according to the following equation:Q.As shown in the figure at 200 K and 500 atm value of compressibility factor is 2 (approx). Then volume of the gas at this point will bea)0.01 Lb)0.09 Lc)0.065 Ld)0.657 LCorrect answer is option 'C'. Can you explain this answer? has been provided alongside types of Sketch shows the plot of Z v/s P for of a hypothetical gas for one mole at three distinct temperature.Boyles temperature is the temperature at which a gas shows ideal behaviour over a pressure range in the low pressure region. Boyles temperature (Tb) = a/Rb . If a plot is obtained at temperatures well below Boyles temperature then the curve will show negative deviation, in low pressure region and positive deviation in the high pressure region. Near critical temperature the curve is more likely as CO2 and the temperature well above critical temperature curve is more like H2 at 0C as shown above. At high pressure suppose all the constant temperature curve varies linearly with pressure according to the following equation:Q.As shown in the figure at 200 K and 500 atm value of compressibility factor is 2 (approx). Then volume of the gas at this point will bea)0.01 Lb)0.09 Lc)0.065 Ld)0.657 LCorrect answer is option 'C'. Can you explain this answer? theory, EduRev gives you an
ample number of questions to practice Sketch shows the plot of Z v/s P for of a hypothetical gas for one mole at three distinct temperature.Boyles temperature is the temperature at which a gas shows ideal behaviour over a pressure range in the low pressure region. Boyles temperature (Tb) = a/Rb . If a plot is obtained at temperatures well below Boyles temperature then the curve will show negative deviation, in low pressure region and positive deviation in the high pressure region. Near critical temperature the curve is more likely as CO2 and the temperature well above critical temperature curve is more like H2 at 0C as shown above. At high pressure suppose all the constant temperature curve varies linearly with pressure according to the following equation:Q.As shown in the figure at 200 K and 500 atm value of compressibility factor is 2 (approx). Then volume of the gas at this point will bea)0.01 Lb)0.09 Lc)0.065 Ld)0.657 LCorrect answer is option 'C'. Can you explain this answer? tests, examples and also practice JEE tests.
|
|
Explore Courses for JEE exam
|
|
Suggested Free Tests
Signup for Free!
Signup to see your scores go up within 7 days! Learn & Practice with 1000+ FREE Notes, Videos & Tests.


|
© EduRev
|
Education Revolution
|


|


Signup to see your scores
go up within 7 days!
Access 1000+ FREE Docs, Videos and Tests
Takes less than 10 seconds to signup