


UPSC Exam > UPSC Questions > Graph given below which shows imports ofthree... Start Learning for Free
Graph given below which shows imports of three different types of steel over a period of six months of a year. Study the graph and answer the three items that follow.
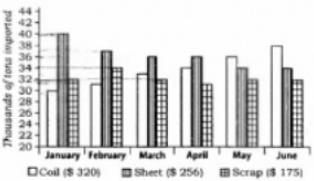
The figures in the brackets indicate the average cost per ton over six months period.
Q. What was the approximate ratio of sheet steel and scrap steel imports in the first three months of the year?
The figures in the brackets indicate the average cost per ton over six months period.
Q. What was the approximate ratio of sheet steel and scrap steel imports in the first three months of the year?
- a)1: 1
- b)1.2: 1
- c)1.4: 1
- d)1.6: 1
Correct answer is option 'B'. Can you explain this answer?

Most Upvoted Answer
Graph given below which shows imports ofthree different types of steel...
Approximate ratio =sheet steel (3months)/scrap steel= (40+37+36)/(32+34+32)=113/98
=1.16~1.2 sheet steel (3months)/scrap steel (3months)=1.2/1=1:2:1 correct answer is optionB"
=1.16~1.2 sheet steel (3months)/scrap steel (3months)=1.2/1=1:2:1 correct answer is optionB"
 | Explore Courses for UPSC exam |
Top Courses for UPSCView all


Top Courses for UPSC
Question Description
Graph given below which shows imports ofthree different types of steel over a period of six months of a year. Study the graph and answer the three items that follow.The figures in the brackets indicate the average cost per ton over six months period.Q.What was the approximate ratio of sheet steel and scrap steel imports in the first three months of the year?a)1: 1b)1.2: 1c)1.4: 1d)1.6: 1Correct answer is option 'B'. Can you explain this answer? for UPSC 2026 is part of UPSC preparation. The Question and answers have been prepared according to the UPSC exam syllabus. Information about Graph given below which shows imports ofthree different types of steel over a period of six months of a year. Study the graph and answer the three items that follow.The figures in the brackets indicate the average cost per ton over six months period.Q.What was the approximate ratio of sheet steel and scrap steel imports in the first three months of the year?a)1: 1b)1.2: 1c)1.4: 1d)1.6: 1Correct answer is option 'B'. Can you explain this answer? covers all topics & solutions for UPSC 2026 Exam. Find important definitions, questions, meanings, examples, exercises and tests below for Graph given below which shows imports ofthree different types of steel over a period of six months of a year. Study the graph and answer the three items that follow.The figures in the brackets indicate the average cost per ton over six months period.Q.What was the approximate ratio of sheet steel and scrap steel imports in the first three months of the year?a)1: 1b)1.2: 1c)1.4: 1d)1.6: 1Correct answer is option 'B'. Can you explain this answer?.
Graph given below which shows imports ofthree different types of steel over a period of six months of a year. Study the graph and answer the three items that follow.The figures in the brackets indicate the average cost per ton over six months period.Q.What was the approximate ratio of sheet steel and scrap steel imports in the first three months of the year?a)1: 1b)1.2: 1c)1.4: 1d)1.6: 1Correct answer is option 'B'. Can you explain this answer? for UPSC 2026 is part of UPSC preparation. The Question and answers have been prepared according to the UPSC exam syllabus. Information about Graph given below which shows imports ofthree different types of steel over a period of six months of a year. Study the graph and answer the three items that follow.The figures in the brackets indicate the average cost per ton over six months period.Q.What was the approximate ratio of sheet steel and scrap steel imports in the first three months of the year?a)1: 1b)1.2: 1c)1.4: 1d)1.6: 1Correct answer is option 'B'. Can you explain this answer? covers all topics & solutions for UPSC 2026 Exam. Find important definitions, questions, meanings, examples, exercises and tests below for Graph given below which shows imports ofthree different types of steel over a period of six months of a year. Study the graph and answer the three items that follow.The figures in the brackets indicate the average cost per ton over six months period.Q.What was the approximate ratio of sheet steel and scrap steel imports in the first three months of the year?a)1: 1b)1.2: 1c)1.4: 1d)1.6: 1Correct answer is option 'B'. Can you explain this answer?.
Solutions for Graph given below which shows imports ofthree different types of steel over a period of six months of a year. Study the graph and answer the three items that follow.The figures in the brackets indicate the average cost per ton over six months period.Q.What was the approximate ratio of sheet steel and scrap steel imports in the first three months of the year?a)1: 1b)1.2: 1c)1.4: 1d)1.6: 1Correct answer is option 'B'. Can you explain this answer? in English & in Hindi are available as part of our courses for UPSC. Download more important topics, notes, lectures and mock test series for UPSC Exam by signing up for free.
Here you can find the meaning of Graph given below which shows imports ofthree different types of steel over a period of six months of a year. Study the graph and answer the three items that follow.The figures in the brackets indicate the average cost per ton over six months period.Q.What was the approximate ratio of sheet steel and scrap steel imports in the first three months of the year?a)1: 1b)1.2: 1c)1.4: 1d)1.6: 1Correct answer is option 'B'. Can you explain this answer? defined & explained in the simplest way possible. Besides giving the explanation of Graph given below which shows imports ofthree different types of steel over a period of six months of a year. Study the graph and answer the three items that follow.The figures in the brackets indicate the average cost per ton over six months period.Q.What was the approximate ratio of sheet steel and scrap steel imports in the first three months of the year?a)1: 1b)1.2: 1c)1.4: 1d)1.6: 1Correct answer is option 'B'. Can you explain this answer?, a detailed solution for Graph given below which shows imports ofthree different types of steel over a period of six months of a year. Study the graph and answer the three items that follow.The figures in the brackets indicate the average cost per ton over six months period.Q.What was the approximate ratio of sheet steel and scrap steel imports in the first three months of the year?a)1: 1b)1.2: 1c)1.4: 1d)1.6: 1Correct answer is option 'B'. Can you explain this answer? has been provided alongside types of Graph given below which shows imports ofthree different types of steel over a period of six months of a year. Study the graph and answer the three items that follow.The figures in the brackets indicate the average cost per ton over six months period.Q.What was the approximate ratio of sheet steel and scrap steel imports in the first three months of the year?a)1: 1b)1.2: 1c)1.4: 1d)1.6: 1Correct answer is option 'B'. Can you explain this answer? theory, EduRev gives you an ample number of questions to practice Graph given below which shows imports ofthree different types of steel over a period of six months of a year. Study the graph and answer the three items that follow.The figures in the brackets indicate the average cost per ton over six months period.Q.What was the approximate ratio of sheet steel and scrap steel imports in the first three months of the year?a)1: 1b)1.2: 1c)1.4: 1d)1.6: 1Correct answer is option 'B'. Can you explain this answer? tests, examples and also practice UPSC tests.
| Explore Courses for UPSC exam |
Top Courses for UPSC
Explore Courses
Signup for Free!
Signup to see your scores go up within 7 days! Learn & Practice with 1000+ FREE Notes, Videos & Tests.


