


UPSC Exam > UPSC Questions > Consider the following graphs. The curves in ... Start Learning for Free
Consider the following graphs. The curves in the graphs indicate different age groups in the populations of two countries A and B over a period of few decades :
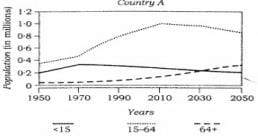
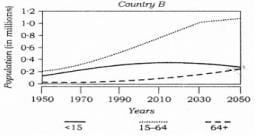
With reference to the above graphs, which of the following are the most logical and rational inferences that can be made?
1. Over the last two and a half decades, the dependency ratio for country B has decreased.
2. By the end of next two and a half decades, the dependency ratio of country A will be much less than that of country B.
3. In the next two decades, the workforce relative to its total population will increase in country B as compared to country A.
Q. Select the correct answer using the code given below.
- a)1 and 2 only
- b)2 and 3 only
- c)1 and 3 only
- d)1, 2 and 3
Correct answer is option 'B'. Can you explain this answer?

Most Upvoted Answer
Consider the following graphs. The curves in the graphs indicate diffe...
1,2 and 3
 | Explore Courses for UPSC exam |
Top Courses for UPSCView all


Top Courses for UPSC
Question Description
Consider the following graphs. The curves in the graphs indicate different age groups in the populations of two countries A and B over a period of few decades :With reference to the above graphs, which of the following are the most logical and rational inferences that can be made?1. Over the last two and a half decades, the dependency ratio for country B has decreased.2. By the end of next two and a half decades, the dependency ratio of country A will be much less than that of country B.3. In the next two decades, the workforce relative to its total population will increase in country B as compared to country A.Q. Select the correct answer using the code given below.a)1 and 2 onlyb)2 and 3 onlyc)1 and 3 onlyd)1, 2 and 3Correct answer is option 'B'. Can you explain this answer? for UPSC 2026 is part of UPSC preparation. The Question and answers have been prepared according to the UPSC exam syllabus. Information about Consider the following graphs. The curves in the graphs indicate different age groups in the populations of two countries A and B over a period of few decades :With reference to the above graphs, which of the following are the most logical and rational inferences that can be made?1. Over the last two and a half decades, the dependency ratio for country B has decreased.2. By the end of next two and a half decades, the dependency ratio of country A will be much less than that of country B.3. In the next two decades, the workforce relative to its total population will increase in country B as compared to country A.Q. Select the correct answer using the code given below.a)1 and 2 onlyb)2 and 3 onlyc)1 and 3 onlyd)1, 2 and 3Correct answer is option 'B'. Can you explain this answer? covers all topics & solutions for UPSC 2026 Exam. Find important definitions, questions, meanings, examples, exercises and tests below for Consider the following graphs. The curves in the graphs indicate different age groups in the populations of two countries A and B over a period of few decades :With reference to the above graphs, which of the following are the most logical and rational inferences that can be made?1. Over the last two and a half decades, the dependency ratio for country B has decreased.2. By the end of next two and a half decades, the dependency ratio of country A will be much less than that of country B.3. In the next two decades, the workforce relative to its total population will increase in country B as compared to country A.Q. Select the correct answer using the code given below.a)1 and 2 onlyb)2 and 3 onlyc)1 and 3 onlyd)1, 2 and 3Correct answer is option 'B'. Can you explain this answer?.
Consider the following graphs. The curves in the graphs indicate different age groups in the populations of two countries A and B over a period of few decades :With reference to the above graphs, which of the following are the most logical and rational inferences that can be made?1. Over the last two and a half decades, the dependency ratio for country B has decreased.2. By the end of next two and a half decades, the dependency ratio of country A will be much less than that of country B.3. In the next two decades, the workforce relative to its total population will increase in country B as compared to country A.Q. Select the correct answer using the code given below.a)1 and 2 onlyb)2 and 3 onlyc)1 and 3 onlyd)1, 2 and 3Correct answer is option 'B'. Can you explain this answer? for UPSC 2026 is part of UPSC preparation. The Question and answers have been prepared according to the UPSC exam syllabus. Information about Consider the following graphs. The curves in the graphs indicate different age groups in the populations of two countries A and B over a period of few decades :With reference to the above graphs, which of the following are the most logical and rational inferences that can be made?1. Over the last two and a half decades, the dependency ratio for country B has decreased.2. By the end of next two and a half decades, the dependency ratio of country A will be much less than that of country B.3. In the next two decades, the workforce relative to its total population will increase in country B as compared to country A.Q. Select the correct answer using the code given below.a)1 and 2 onlyb)2 and 3 onlyc)1 and 3 onlyd)1, 2 and 3Correct answer is option 'B'. Can you explain this answer? covers all topics & solutions for UPSC 2026 Exam. Find important definitions, questions, meanings, examples, exercises and tests below for Consider the following graphs. The curves in the graphs indicate different age groups in the populations of two countries A and B over a period of few decades :With reference to the above graphs, which of the following are the most logical and rational inferences that can be made?1. Over the last two and a half decades, the dependency ratio for country B has decreased.2. By the end of next two and a half decades, the dependency ratio of country A will be much less than that of country B.3. In the next two decades, the workforce relative to its total population will increase in country B as compared to country A.Q. Select the correct answer using the code given below.a)1 and 2 onlyb)2 and 3 onlyc)1 and 3 onlyd)1, 2 and 3Correct answer is option 'B'. Can you explain this answer?.
Solutions for Consider the following graphs. The curves in the graphs indicate different age groups in the populations of two countries A and B over a period of few decades :With reference to the above graphs, which of the following are the most logical and rational inferences that can be made?1. Over the last two and a half decades, the dependency ratio for country B has decreased.2. By the end of next two and a half decades, the dependency ratio of country A will be much less than that of country B.3. In the next two decades, the workforce relative to its total population will increase in country B as compared to country A.Q. Select the correct answer using the code given below.a)1 and 2 onlyb)2 and 3 onlyc)1 and 3 onlyd)1, 2 and 3Correct answer is option 'B'. Can you explain this answer? in English & in Hindi are available as part of our courses for UPSC. Download more important topics, notes, lectures and mock test series for UPSC Exam by signing up for free.
Here you can find the meaning of Consider the following graphs. The curves in the graphs indicate different age groups in the populations of two countries A and B over a period of few decades :With reference to the above graphs, which of the following are the most logical and rational inferences that can be made?1. Over the last two and a half decades, the dependency ratio for country B has decreased.2. By the end of next two and a half decades, the dependency ratio of country A will be much less than that of country B.3. In the next two decades, the workforce relative to its total population will increase in country B as compared to country A.Q. Select the correct answer using the code given below.a)1 and 2 onlyb)2 and 3 onlyc)1 and 3 onlyd)1, 2 and 3Correct answer is option 'B'. Can you explain this answer? defined & explained in the simplest way possible. Besides giving the explanation of Consider the following graphs. The curves in the graphs indicate different age groups in the populations of two countries A and B over a period of few decades :With reference to the above graphs, which of the following are the most logical and rational inferences that can be made?1. Over the last two and a half decades, the dependency ratio for country B has decreased.2. By the end of next two and a half decades, the dependency ratio of country A will be much less than that of country B.3. In the next two decades, the workforce relative to its total population will increase in country B as compared to country A.Q. Select the correct answer using the code given below.a)1 and 2 onlyb)2 and 3 onlyc)1 and 3 onlyd)1, 2 and 3Correct answer is option 'B'. Can you explain this answer?, a detailed solution for Consider the following graphs. The curves in the graphs indicate different age groups in the populations of two countries A and B over a period of few decades :With reference to the above graphs, which of the following are the most logical and rational inferences that can be made?1. Over the last two and a half decades, the dependency ratio for country B has decreased.2. By the end of next two and a half decades, the dependency ratio of country A will be much less than that of country B.3. In the next two decades, the workforce relative to its total population will increase in country B as compared to country A.Q. Select the correct answer using the code given below.a)1 and 2 onlyb)2 and 3 onlyc)1 and 3 onlyd)1, 2 and 3Correct answer is option 'B'. Can you explain this answer? has been provided alongside types of Consider the following graphs. The curves in the graphs indicate different age groups in the populations of two countries A and B over a period of few decades :With reference to the above graphs, which of the following are the most logical and rational inferences that can be made?1. Over the last two and a half decades, the dependency ratio for country B has decreased.2. By the end of next two and a half decades, the dependency ratio of country A will be much less than that of country B.3. In the next two decades, the workforce relative to its total population will increase in country B as compared to country A.Q. Select the correct answer using the code given below.a)1 and 2 onlyb)2 and 3 onlyc)1 and 3 onlyd)1, 2 and 3Correct answer is option 'B'. Can you explain this answer? theory, EduRev gives you an ample number of questions to practice Consider the following graphs. The curves in the graphs indicate different age groups in the populations of two countries A and B over a period of few decades :With reference to the above graphs, which of the following are the most logical and rational inferences that can be made?1. Over the last two and a half decades, the dependency ratio for country B has decreased.2. By the end of next two and a half decades, the dependency ratio of country A will be much less than that of country B.3. In the next two decades, the workforce relative to its total population will increase in country B as compared to country A.Q. Select the correct answer using the code given below.a)1 and 2 onlyb)2 and 3 onlyc)1 and 3 onlyd)1, 2 and 3Correct answer is option 'B'. Can you explain this answer? tests, examples and also practice UPSC tests.
| Explore Courses for UPSC exam |
Top Courses for UPSC
Explore Courses
Signup for Free!
Signup to see your scores go up within 7 days! Learn & Practice with 1000+ FREE Notes, Videos & Tests.


