Banking Exams Exam > Banking Exams Questions > One pie chart is followed by two tables. Pie...
Start Learning for Free
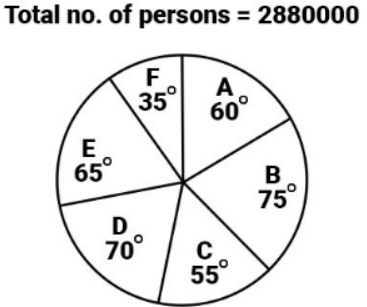
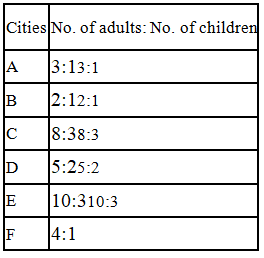
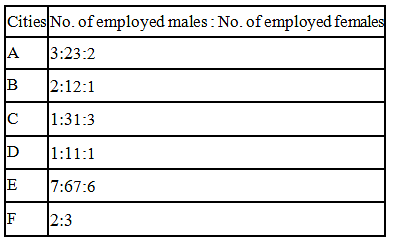
One pie chart is followed by two tables. Pie chart shows the number of persons living in different cities. First table shows the respective ratio of the number of adults to the number of children in each city and the second table shows the respective ratio of the number of employed males and that of employed females. Study the given data carefully and answer the related question.


Q. If 45% of the total number of adults are males and the respective ratio of the number of male children to that of female children is 2∶1 in city A, then what is the respective ratio of the number of males to that of females in this city?
- a)123 ∶ 119
- b)119 ∶ 121
- c)117 ∶ 119
- d)121 ∶ 119
- e)None of these
Correct answer is option 'D'. Can you explain this answer?
Most Upvoted Answer
One pie chart is followed by two tables. Pie chart shows the number o...
According to given data,
Total number of persons = 2880000
Number of persons in city A in degrees = 600
Therefore,
Total population of city A = 2880000 × 60/360 = 480000
It is given that, the number of adults : number of children = 3:1
Total no. of children in city A = 480000 × 1/4 = 120000
Total no. of male children in city A =120000 × 2/3 = 80000
Total no. of adult persons in city A =480000−120000=360000
As, the total number of adult males = 45%
Total no. of adult males in city A = 360000 × 45/100 = 162000
Total no. of males in city A = 162000 + 80000 = 242000
Total no. of females in city A = 480000 − 242000 = 238000
∴ Required ratio = 242000 ∶ 238000 = 121 : 119

|
Explore Courses for Banking Exams exam
|

|
Similar Banking Exams Doubts
One pie chart is followed by two tables. Pie chart shows the number of persons living in different cities. First table shows the respective ratio of the number of adults to the number of children in each city and the second table shows the respective ratio of the number of employed males and that of employed females. Study the given data carefully and answer the related question.Q. If 45% of the total number of adults are males and the respective ratio of the number of male children to that of female children is 2∶1 in city A, then what is the respective ratio of the number of males to that of females in this city?a)123 ∶ 119b)119 ∶ 121c)117 ∶ 119d)121 ∶ 119e)None of theseCorrect answer is option 'D'. Can you explain this answer?
Question Description
One pie chart is followed by two tables. Pie chart shows the number of persons living in different cities. First table shows the respective ratio of the number of adults to the number of children in each city and the second table shows the respective ratio of the number of employed males and that of employed females. Study the given data carefully and answer the related question.Q. If 45% of the total number of adults are males and the respective ratio of the number of male children to that of female children is 2∶1 in city A, then what is the respective ratio of the number of males to that of females in this city?a)123 ∶ 119b)119 ∶ 121c)117 ∶ 119d)121 ∶ 119e)None of theseCorrect answer is option 'D'. Can you explain this answer? for Banking Exams 2025 is part of Banking Exams preparation. The Question and answers have been prepared according to the Banking Exams exam syllabus. Information about One pie chart is followed by two tables. Pie chart shows the number of persons living in different cities. First table shows the respective ratio of the number of adults to the number of children in each city and the second table shows the respective ratio of the number of employed males and that of employed females. Study the given data carefully and answer the related question.Q. If 45% of the total number of adults are males and the respective ratio of the number of male children to that of female children is 2∶1 in city A, then what is the respective ratio of the number of males to that of females in this city?a)123 ∶ 119b)119 ∶ 121c)117 ∶ 119d)121 ∶ 119e)None of theseCorrect answer is option 'D'. Can you explain this answer? covers all topics & solutions for Banking Exams 2025 Exam. Find important definitions, questions, meanings, examples, exercises and tests below for One pie chart is followed by two tables. Pie chart shows the number of persons living in different cities. First table shows the respective ratio of the number of adults to the number of children in each city and the second table shows the respective ratio of the number of employed males and that of employed females. Study the given data carefully and answer the related question.Q. If 45% of the total number of adults are males and the respective ratio of the number of male children to that of female children is 2∶1 in city A, then what is the respective ratio of the number of males to that of females in this city?a)123 ∶ 119b)119 ∶ 121c)117 ∶ 119d)121 ∶ 119e)None of theseCorrect answer is option 'D'. Can you explain this answer?.
One pie chart is followed by two tables. Pie chart shows the number of persons living in different cities. First table shows the respective ratio of the number of adults to the number of children in each city and the second table shows the respective ratio of the number of employed males and that of employed females. Study the given data carefully and answer the related question.Q. If 45% of the total number of adults are males and the respective ratio of the number of male children to that of female children is 2∶1 in city A, then what is the respective ratio of the number of males to that of females in this city?a)123 ∶ 119b)119 ∶ 121c)117 ∶ 119d)121 ∶ 119e)None of theseCorrect answer is option 'D'. Can you explain this answer? for Banking Exams 2025 is part of Banking Exams preparation. The Question and answers have been prepared according to the Banking Exams exam syllabus. Information about One pie chart is followed by two tables. Pie chart shows the number of persons living in different cities. First table shows the respective ratio of the number of adults to the number of children in each city and the second table shows the respective ratio of the number of employed males and that of employed females. Study the given data carefully and answer the related question.Q. If 45% of the total number of adults are males and the respective ratio of the number of male children to that of female children is 2∶1 in city A, then what is the respective ratio of the number of males to that of females in this city?a)123 ∶ 119b)119 ∶ 121c)117 ∶ 119d)121 ∶ 119e)None of theseCorrect answer is option 'D'. Can you explain this answer? covers all topics & solutions for Banking Exams 2025 Exam. Find important definitions, questions, meanings, examples, exercises and tests below for One pie chart is followed by two tables. Pie chart shows the number of persons living in different cities. First table shows the respective ratio of the number of adults to the number of children in each city and the second table shows the respective ratio of the number of employed males and that of employed females. Study the given data carefully and answer the related question.Q. If 45% of the total number of adults are males and the respective ratio of the number of male children to that of female children is 2∶1 in city A, then what is the respective ratio of the number of males to that of females in this city?a)123 ∶ 119b)119 ∶ 121c)117 ∶ 119d)121 ∶ 119e)None of theseCorrect answer is option 'D'. Can you explain this answer?.
Solutions for One pie chart is followed by two tables. Pie chart shows the number of persons living in different cities. First table shows the respective ratio of the number of adults to the number of children in each city and the second table shows the respective ratio of the number of employed males and that of employed females. Study the given data carefully and answer the related question.Q. If 45% of the total number of adults are males and the respective ratio of the number of male children to that of female children is 2∶1 in city A, then what is the respective ratio of the number of males to that of females in this city?a)123 ∶ 119b)119 ∶ 121c)117 ∶ 119d)121 ∶ 119e)None of theseCorrect answer is option 'D'. Can you explain this answer? in English & in Hindi are available as part of our courses for Banking Exams.
Download more important topics, notes, lectures and mock test series for Banking Exams Exam by signing up for free.
Here you can find the meaning of One pie chart is followed by two tables. Pie chart shows the number of persons living in different cities. First table shows the respective ratio of the number of adults to the number of children in each city and the second table shows the respective ratio of the number of employed males and that of employed females. Study the given data carefully and answer the related question.Q. If 45% of the total number of adults are males and the respective ratio of the number of male children to that of female children is 2∶1 in city A, then what is the respective ratio of the number of males to that of females in this city?a)123 ∶ 119b)119 ∶ 121c)117 ∶ 119d)121 ∶ 119e)None of theseCorrect answer is option 'D'. Can you explain this answer? defined & explained in the simplest way possible. Besides giving the explanation of
One pie chart is followed by two tables. Pie chart shows the number of persons living in different cities. First table shows the respective ratio of the number of adults to the number of children in each city and the second table shows the respective ratio of the number of employed males and that of employed females. Study the given data carefully and answer the related question.Q. If 45% of the total number of adults are males and the respective ratio of the number of male children to that of female children is 2∶1 in city A, then what is the respective ratio of the number of males to that of females in this city?a)123 ∶ 119b)119 ∶ 121c)117 ∶ 119d)121 ∶ 119e)None of theseCorrect answer is option 'D'. Can you explain this answer?, a detailed solution for One pie chart is followed by two tables. Pie chart shows the number of persons living in different cities. First table shows the respective ratio of the number of adults to the number of children in each city and the second table shows the respective ratio of the number of employed males and that of employed females. Study the given data carefully and answer the related question.Q. If 45% of the total number of adults are males and the respective ratio of the number of male children to that of female children is 2∶1 in city A, then what is the respective ratio of the number of males to that of females in this city?a)123 ∶ 119b)119 ∶ 121c)117 ∶ 119d)121 ∶ 119e)None of theseCorrect answer is option 'D'. Can you explain this answer? has been provided alongside types of One pie chart is followed by two tables. Pie chart shows the number of persons living in different cities. First table shows the respective ratio of the number of adults to the number of children in each city and the second table shows the respective ratio of the number of employed males and that of employed females. Study the given data carefully and answer the related question.Q. If 45% of the total number of adults are males and the respective ratio of the number of male children to that of female children is 2∶1 in city A, then what is the respective ratio of the number of males to that of females in this city?a)123 ∶ 119b)119 ∶ 121c)117 ∶ 119d)121 ∶ 119e)None of theseCorrect answer is option 'D'. Can you explain this answer? theory, EduRev gives you an
ample number of questions to practice One pie chart is followed by two tables. Pie chart shows the number of persons living in different cities. First table shows the respective ratio of the number of adults to the number of children in each city and the second table shows the respective ratio of the number of employed males and that of employed females. Study the given data carefully and answer the related question.Q. If 45% of the total number of adults are males and the respective ratio of the number of male children to that of female children is 2∶1 in city A, then what is the respective ratio of the number of males to that of females in this city?a)123 ∶ 119b)119 ∶ 121c)117 ∶ 119d)121 ∶ 119e)None of theseCorrect answer is option 'D'. Can you explain this answer? tests, examples and also practice Banking Exams tests.

|
Explore Courses for Banking Exams exam
|

|
Signup for Free!
Signup to see your scores go up within 7 days! Learn & Practice with 1000+ FREE Notes, Videos & Tests.


