


SAT Exam > SAT Questions > DIRECTIONS for question: The following graph ... Start Learning for Free
DIRECTIONS for question: The following graph gives the movement of the stock market index, CNX Nifty over one week.
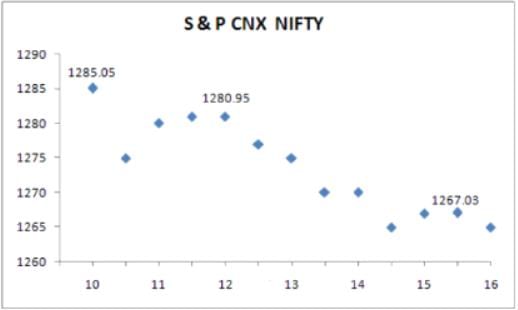
Q. If I had invested Rs 100 in S&P CNX Nifty stocks at the beginning of the time period, what would be its nearest value at the end of the period?
- a)Rs 99.50
- b)Rs 98.50
- c)Rs 97.50
- d)Rs 96.50
Correct answer is option 'B'. Can you explain this answer?

Verified Answer
DIRECTIONS for question: The following graph gives the movement of the...
Percentage fall in Nifty: (1,285 – 1,265)/1,285
= 18/1,285 = 1.4 %,
hence 98.50 is the best answer.
= 18/1,285 = 1.4 %,
hence 98.50 is the best answer.
Most Upvoted Answer
DIRECTIONS for question: The following graph gives the movement of the...
Percentage fall in Nifty: (1,285 – 1,265)/1,285
= 18/1,285 = 1.4 %,
hence 98.50 is the best answer.
= 18/1,285 = 1.4 %,
hence 98.50 is the best answer.
 | Explore Courses for SAT exam |
Top Courses for SATView all


Top Courses for SAT
Question Description
DIRECTIONS for question: The following graph gives the movement of the stock market index, CNX Nifty over one week.Q.If I had invested Rs 100 in S&P CNX Nifty stocks at the beginning of the time period, what would be its nearest value at the end of the period?a)Rs 99.50b)Rs 98.50c)Rs 97.50d)Rs 96.50Correct answer is option 'B'. Can you explain this answer? for SAT 2026 is part of SAT preparation. The Question and answers have been prepared according to the SAT exam syllabus. Information about DIRECTIONS for question: The following graph gives the movement of the stock market index, CNX Nifty over one week.Q.If I had invested Rs 100 in S&P CNX Nifty stocks at the beginning of the time period, what would be its nearest value at the end of the period?a)Rs 99.50b)Rs 98.50c)Rs 97.50d)Rs 96.50Correct answer is option 'B'. Can you explain this answer? covers all topics & solutions for SAT 2026 Exam. Find important definitions, questions, meanings, examples, exercises and tests below for DIRECTIONS for question: The following graph gives the movement of the stock market index, CNX Nifty over one week.Q.If I had invested Rs 100 in S&P CNX Nifty stocks at the beginning of the time period, what would be its nearest value at the end of the period?a)Rs 99.50b)Rs 98.50c)Rs 97.50d)Rs 96.50Correct answer is option 'B'. Can you explain this answer?.
DIRECTIONS for question: The following graph gives the movement of the stock market index, CNX Nifty over one week.Q.If I had invested Rs 100 in S&P CNX Nifty stocks at the beginning of the time period, what would be its nearest value at the end of the period?a)Rs 99.50b)Rs 98.50c)Rs 97.50d)Rs 96.50Correct answer is option 'B'. Can you explain this answer? for SAT 2026 is part of SAT preparation. The Question and answers have been prepared according to the SAT exam syllabus. Information about DIRECTIONS for question: The following graph gives the movement of the stock market index, CNX Nifty over one week.Q.If I had invested Rs 100 in S&P CNX Nifty stocks at the beginning of the time period, what would be its nearest value at the end of the period?a)Rs 99.50b)Rs 98.50c)Rs 97.50d)Rs 96.50Correct answer is option 'B'. Can you explain this answer? covers all topics & solutions for SAT 2026 Exam. Find important definitions, questions, meanings, examples, exercises and tests below for DIRECTIONS for question: The following graph gives the movement of the stock market index, CNX Nifty over one week.Q.If I had invested Rs 100 in S&P CNX Nifty stocks at the beginning of the time period, what would be its nearest value at the end of the period?a)Rs 99.50b)Rs 98.50c)Rs 97.50d)Rs 96.50Correct answer is option 'B'. Can you explain this answer?.
Solutions for DIRECTIONS for question: The following graph gives the movement of the stock market index, CNX Nifty over one week.Q.If I had invested Rs 100 in S&P CNX Nifty stocks at the beginning of the time period, what would be its nearest value at the end of the period?a)Rs 99.50b)Rs 98.50c)Rs 97.50d)Rs 96.50Correct answer is option 'B'. Can you explain this answer? in English & in Hindi are available as part of our courses for SAT. Download more important topics, notes, lectures and mock test series for SAT Exam by signing up for free.
Here you can find the meaning of DIRECTIONS for question: The following graph gives the movement of the stock market index, CNX Nifty over one week.Q.If I had invested Rs 100 in S&P CNX Nifty stocks at the beginning of the time period, what would be its nearest value at the end of the period?a)Rs 99.50b)Rs 98.50c)Rs 97.50d)Rs 96.50Correct answer is option 'B'. Can you explain this answer? defined & explained in the simplest way possible. Besides giving the explanation of DIRECTIONS for question: The following graph gives the movement of the stock market index, CNX Nifty over one week.Q.If I had invested Rs 100 in S&P CNX Nifty stocks at the beginning of the time period, what would be its nearest value at the end of the period?a)Rs 99.50b)Rs 98.50c)Rs 97.50d)Rs 96.50Correct answer is option 'B'. Can you explain this answer?, a detailed solution for DIRECTIONS for question: The following graph gives the movement of the stock market index, CNX Nifty over one week.Q.If I had invested Rs 100 in S&P CNX Nifty stocks at the beginning of the time period, what would be its nearest value at the end of the period?a)Rs 99.50b)Rs 98.50c)Rs 97.50d)Rs 96.50Correct answer is option 'B'. Can you explain this answer? has been provided alongside types of DIRECTIONS for question: The following graph gives the movement of the stock market index, CNX Nifty over one week.Q.If I had invested Rs 100 in S&P CNX Nifty stocks at the beginning of the time period, what would be its nearest value at the end of the period?a)Rs 99.50b)Rs 98.50c)Rs 97.50d)Rs 96.50Correct answer is option 'B'. Can you explain this answer? theory, EduRev gives you an ample number of questions to practice DIRECTIONS for question: The following graph gives the movement of the stock market index, CNX Nifty over one week.Q.If I had invested Rs 100 in S&P CNX Nifty stocks at the beginning of the time period, what would be its nearest value at the end of the period?a)Rs 99.50b)Rs 98.50c)Rs 97.50d)Rs 96.50Correct answer is option 'B'. Can you explain this answer? tests, examples and also practice SAT tests.
| Explore Courses for SAT exam |
Top Courses for SAT
Explore Courses
Signup for Free!
Signup to see your scores go up within 7 days! Learn & Practice with 1000+ FREE Notes, Videos & Tests.


