


Banking Exams Exam > Banking Exams Questions > Direction:The given pie chart shows the perce... Start Learning for Free
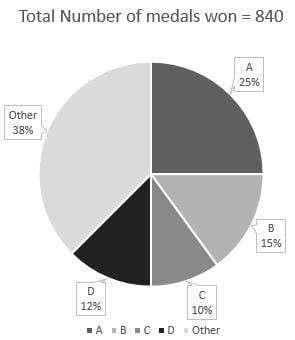
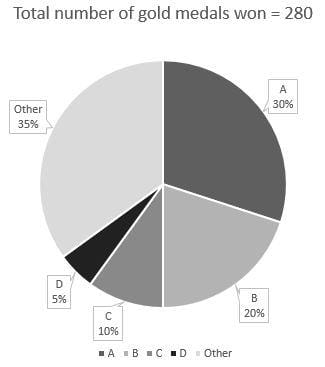
Direction: The given pie chart shows the percentage distribution of the medals won by the top four teams and the others in international games. The first pie chart gives the distribution of the total number of medals won, while the second pie chart gives the distribution of the total number of gold medals won by the teams. Study the pie charts and answer the questions that follow.
Q. The total number of silver and bronze medals won in the international games is equal. The total number of medals won by team F is 3/40 of the total medals. If the number of gold and silver medals won by team F is 33.33% and 22.22% of the total medals won by team F, then how many bronze medals were won by team F?
- a)14
- b)18
- c)21
- d)24
- e)28
Correct answer is option 'E'. Can you explain this answer?

Most Upvoted Answer
Direction:The given pie chart shows the percentage distribution of the...
Total no. of medals won = 840
Total no. of gold medals won = 280
No. of silver & bronze medals won are equal,
Total no. of silver medals won = Total no. of bronze medals won =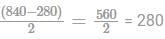
Now,
Total no. of medals won by team F = (3/40) × 840 = 63
Total no. of gold medals won by team F = 33.33% of 63 = (1/3) × 63 = 21
Total no. of silver medals won by team F = 22.22% of 63 = (2/9) × 63 = 14
∴ Total no. of bronze medals won by team F = 63-21-14 = 28
 | Explore Courses for Banking Exams exam |
Top Courses for Banking ExamsView all


Top Courses for Banking Exams
Question Description
Direction:The given pie chart shows the percentage distribution of the medals won by the top four teams and the others in international games. The first pie chart gives the distribution of the total number of medals won, while the second pie chart gives the distribution of the total number of gold medals won by the teams. Study the pie charts and answer the questions that follow.Q. The total number of silver and bronze medals won in the international games is equal. The total number of medals won by team F is3/40of the total medals. If the number of gold and silver medals won by team F is 33.33% and 22.22% of the total medals won by team F, then how many bronze medals were won by team F?a)14b)18c)21d)24e)28Correct answer is option 'E'. Can you explain this answer? for Banking Exams 2026 is part of Banking Exams preparation. The Question and answers have been prepared according to the Banking Exams exam syllabus. Information about Direction:The given pie chart shows the percentage distribution of the medals won by the top four teams and the others in international games. The first pie chart gives the distribution of the total number of medals won, while the second pie chart gives the distribution of the total number of gold medals won by the teams. Study the pie charts and answer the questions that follow.Q. The total number of silver and bronze medals won in the international games is equal. The total number of medals won by team F is3/40of the total medals. If the number of gold and silver medals won by team F is 33.33% and 22.22% of the total medals won by team F, then how many bronze medals were won by team F?a)14b)18c)21d)24e)28Correct answer is option 'E'. Can you explain this answer? covers all topics & solutions for Banking Exams 2026 Exam. Find important definitions, questions, meanings, examples, exercises and tests below for Direction:The given pie chart shows the percentage distribution of the medals won by the top four teams and the others in international games. The first pie chart gives the distribution of the total number of medals won, while the second pie chart gives the distribution of the total number of gold medals won by the teams. Study the pie charts and answer the questions that follow.Q. The total number of silver and bronze medals won in the international games is equal. The total number of medals won by team F is3/40of the total medals. If the number of gold and silver medals won by team F is 33.33% and 22.22% of the total medals won by team F, then how many bronze medals were won by team F?a)14b)18c)21d)24e)28Correct answer is option 'E'. Can you explain this answer?.
Direction:The given pie chart shows the percentage distribution of the medals won by the top four teams and the others in international games. The first pie chart gives the distribution of the total number of medals won, while the second pie chart gives the distribution of the total number of gold medals won by the teams. Study the pie charts and answer the questions that follow.Q. The total number of silver and bronze medals won in the international games is equal. The total number of medals won by team F is3/40of the total medals. If the number of gold and silver medals won by team F is 33.33% and 22.22% of the total medals won by team F, then how many bronze medals were won by team F?a)14b)18c)21d)24e)28Correct answer is option 'E'. Can you explain this answer? for Banking Exams 2026 is part of Banking Exams preparation. The Question and answers have been prepared according to the Banking Exams exam syllabus. Information about Direction:The given pie chart shows the percentage distribution of the medals won by the top four teams and the others in international games. The first pie chart gives the distribution of the total number of medals won, while the second pie chart gives the distribution of the total number of gold medals won by the teams. Study the pie charts and answer the questions that follow.Q. The total number of silver and bronze medals won in the international games is equal. The total number of medals won by team F is3/40of the total medals. If the number of gold and silver medals won by team F is 33.33% and 22.22% of the total medals won by team F, then how many bronze medals were won by team F?a)14b)18c)21d)24e)28Correct answer is option 'E'. Can you explain this answer? covers all topics & solutions for Banking Exams 2026 Exam. Find important definitions, questions, meanings, examples, exercises and tests below for Direction:The given pie chart shows the percentage distribution of the medals won by the top four teams and the others in international games. The first pie chart gives the distribution of the total number of medals won, while the second pie chart gives the distribution of the total number of gold medals won by the teams. Study the pie charts and answer the questions that follow.Q. The total number of silver and bronze medals won in the international games is equal. The total number of medals won by team F is3/40of the total medals. If the number of gold and silver medals won by team F is 33.33% and 22.22% of the total medals won by team F, then how many bronze medals were won by team F?a)14b)18c)21d)24e)28Correct answer is option 'E'. Can you explain this answer?.
Solutions for Direction:The given pie chart shows the percentage distribution of the medals won by the top four teams and the others in international games. The first pie chart gives the distribution of the total number of medals won, while the second pie chart gives the distribution of the total number of gold medals won by the teams. Study the pie charts and answer the questions that follow.Q. The total number of silver and bronze medals won in the international games is equal. The total number of medals won by team F is3/40of the total medals. If the number of gold and silver medals won by team F is 33.33% and 22.22% of the total medals won by team F, then how many bronze medals were won by team F?a)14b)18c)21d)24e)28Correct answer is option 'E'. Can you explain this answer? in English & in Hindi are available as part of our courses for Banking Exams. Download more important topics, notes, lectures and mock test series for Banking Exams Exam by signing up for free.
Here you can find the meaning of Direction:The given pie chart shows the percentage distribution of the medals won by the top four teams and the others in international games. The first pie chart gives the distribution of the total number of medals won, while the second pie chart gives the distribution of the total number of gold medals won by the teams. Study the pie charts and answer the questions that follow.Q. The total number of silver and bronze medals won in the international games is equal. The total number of medals won by team F is3/40of the total medals. If the number of gold and silver medals won by team F is 33.33% and 22.22% of the total medals won by team F, then how many bronze medals were won by team F?a)14b)18c)21d)24e)28Correct answer is option 'E'. Can you explain this answer? defined & explained in the simplest way possible. Besides giving the explanation of Direction:The given pie chart shows the percentage distribution of the medals won by the top four teams and the others in international games. The first pie chart gives the distribution of the total number of medals won, while the second pie chart gives the distribution of the total number of gold medals won by the teams. Study the pie charts and answer the questions that follow.Q. The total number of silver and bronze medals won in the international games is equal. The total number of medals won by team F is3/40of the total medals. If the number of gold and silver medals won by team F is 33.33% and 22.22% of the total medals won by team F, then how many bronze medals were won by team F?a)14b)18c)21d)24e)28Correct answer is option 'E'. Can you explain this answer?, a detailed solution for Direction:The given pie chart shows the percentage distribution of the medals won by the top four teams and the others in international games. The first pie chart gives the distribution of the total number of medals won, while the second pie chart gives the distribution of the total number of gold medals won by the teams. Study the pie charts and answer the questions that follow.Q. The total number of silver and bronze medals won in the international games is equal. The total number of medals won by team F is3/40of the total medals. If the number of gold and silver medals won by team F is 33.33% and 22.22% of the total medals won by team F, then how many bronze medals were won by team F?a)14b)18c)21d)24e)28Correct answer is option 'E'. Can you explain this answer? has been provided alongside types of Direction:The given pie chart shows the percentage distribution of the medals won by the top four teams and the others in international games. The first pie chart gives the distribution of the total number of medals won, while the second pie chart gives the distribution of the total number of gold medals won by the teams. Study the pie charts and answer the questions that follow.Q. The total number of silver and bronze medals won in the international games is equal. The total number of medals won by team F is3/40of the total medals. If the number of gold and silver medals won by team F is 33.33% and 22.22% of the total medals won by team F, then how many bronze medals were won by team F?a)14b)18c)21d)24e)28Correct answer is option 'E'. Can you explain this answer? theory, EduRev gives you an ample number of questions to practice Direction:The given pie chart shows the percentage distribution of the medals won by the top four teams and the others in international games. The first pie chart gives the distribution of the total number of medals won, while the second pie chart gives the distribution of the total number of gold medals won by the teams. Study the pie charts and answer the questions that follow.Q. The total number of silver and bronze medals won in the international games is equal. The total number of medals won by team F is3/40of the total medals. If the number of gold and silver medals won by team F is 33.33% and 22.22% of the total medals won by team F, then how many bronze medals were won by team F?a)14b)18c)21d)24e)28Correct answer is option 'E'. Can you explain this answer? tests, examples and also practice Banking Exams tests.
| Explore Courses for Banking Exams exam |
Top Courses for Banking Exams
Explore Courses
Signup for Free!
Signup to see your scores go up within 7 days! Learn & Practice with 1000+ FREE Notes, Videos & Tests.


