Civil Engineering (CE) Exam > Civil Engineering (CE) Questions > The standard plasticity chart to classify fin...
Start Learning for Free
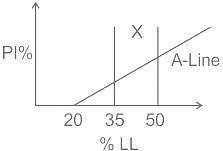
The standard plasticity chart to classify fine grained soils is shown in the figure below.

What does the area marked 'X' represent?

What does the area marked 'X' represent?
- a)Sit of low plasticity
- b)Clay of high plasticity
- c)Organic soil of medium plasticity
- d)Clay of intermediate plasticity
Correct answer is option 'D'. Can you explain this answer?
| FREE This question is part of | Download PDF Attempt this Test |
Most Upvoted Answer
The standard plasticity chart to classify fine grained soils is shown ...
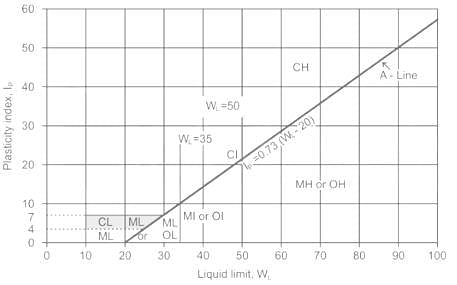
Plasticity chart :
- It is a graph between plasticity index (IP) and liquid limit (WL) in percentage which is used for the classification of fine-grained soils as per the Indian Standard Soil Classification System(ISSCS).
- If more than 50% percent of soil passes through a 75-micron sieve, then it is classified as fine-grained soil.

- The 'A' line in this chart is expressed as IP = 0.73 (WL - 20), , where IP = plasticity index , WL = liquid limit
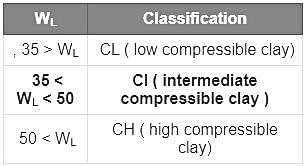
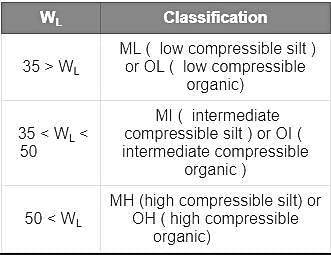
- Depending on the point in the chart, fine soils are divided into clays (C), silts (M), or organic soils (O).
- The organic content is expressed as a percentage of the mass of organic matter in a given mass of soil to the mass of the dry soil solids.
- The 'U' line in this chart is expressed as IP = 0.9( WL - 8).
Clays generally plot above the plasticity chart's A-Line, whereas silts generally plot below it.

If the point gets plotted below A-line, then we need to find out whether the soil is organic or inorganic. If it's inorganic below A-line then it is silt ( M )


If the point gets plotted below A-line, then we need to find out whether the soil is organic or inorganic. If it's inorganic below A-line then it is silt ( M )

Attention Civil Engineering (CE) Students!
To make sure you are not studying endlessly, EduRev has designed Civil Engineering (CE) study material, with Structured Courses, Videos, & Test Series. Plus get personalized analysis, doubt solving and improvement plans to achieve a great score in Civil Engineering (CE).

|
Explore Courses for Civil Engineering (CE) exam
|

|
The standard plasticity chart to classify fine grained soils is shown in the figure below.What does the area marked X represent?a)Sit of low plasticityb)Clay of high plasticityc)Organic soil of medium plasticityd)Clay of intermediate plasticityCorrect answer is option 'D'. Can you explain this answer?
Question Description
The standard plasticity chart to classify fine grained soils is shown in the figure below.What does the area marked X represent?a)Sit of low plasticityb)Clay of high plasticityc)Organic soil of medium plasticityd)Clay of intermediate plasticityCorrect answer is option 'D'. Can you explain this answer? for Civil Engineering (CE) 2024 is part of Civil Engineering (CE) preparation. The Question and answers have been prepared according to the Civil Engineering (CE) exam syllabus. Information about The standard plasticity chart to classify fine grained soils is shown in the figure below.What does the area marked X represent?a)Sit of low plasticityb)Clay of high plasticityc)Organic soil of medium plasticityd)Clay of intermediate plasticityCorrect answer is option 'D'. Can you explain this answer? covers all topics & solutions for Civil Engineering (CE) 2024 Exam. Find important definitions, questions, meanings, examples, exercises and tests below for The standard plasticity chart to classify fine grained soils is shown in the figure below.What does the area marked X represent?a)Sit of low plasticityb)Clay of high plasticityc)Organic soil of medium plasticityd)Clay of intermediate plasticityCorrect answer is option 'D'. Can you explain this answer?.
The standard plasticity chart to classify fine grained soils is shown in the figure below.What does the area marked X represent?a)Sit of low plasticityb)Clay of high plasticityc)Organic soil of medium plasticityd)Clay of intermediate plasticityCorrect answer is option 'D'. Can you explain this answer? for Civil Engineering (CE) 2024 is part of Civil Engineering (CE) preparation. The Question and answers have been prepared according to the Civil Engineering (CE) exam syllabus. Information about The standard plasticity chart to classify fine grained soils is shown in the figure below.What does the area marked X represent?a)Sit of low plasticityb)Clay of high plasticityc)Organic soil of medium plasticityd)Clay of intermediate plasticityCorrect answer is option 'D'. Can you explain this answer? covers all topics & solutions for Civil Engineering (CE) 2024 Exam. Find important definitions, questions, meanings, examples, exercises and tests below for The standard plasticity chart to classify fine grained soils is shown in the figure below.What does the area marked X represent?a)Sit of low plasticityb)Clay of high plasticityc)Organic soil of medium plasticityd)Clay of intermediate plasticityCorrect answer is option 'D'. Can you explain this answer?.
Solutions for The standard plasticity chart to classify fine grained soils is shown in the figure below.What does the area marked X represent?a)Sit of low plasticityb)Clay of high plasticityc)Organic soil of medium plasticityd)Clay of intermediate plasticityCorrect answer is option 'D'. Can you explain this answer? in English & in Hindi are available as part of our courses for Civil Engineering (CE).
Download more important topics, notes, lectures and mock test series for Civil Engineering (CE) Exam by signing up for free.
Here you can find the meaning of The standard plasticity chart to classify fine grained soils is shown in the figure below.What does the area marked X represent?a)Sit of low plasticityb)Clay of high plasticityc)Organic soil of medium plasticityd)Clay of intermediate plasticityCorrect answer is option 'D'. Can you explain this answer? defined & explained in the simplest way possible. Besides giving the explanation of
The standard plasticity chart to classify fine grained soils is shown in the figure below.What does the area marked X represent?a)Sit of low plasticityb)Clay of high plasticityc)Organic soil of medium plasticityd)Clay of intermediate plasticityCorrect answer is option 'D'. Can you explain this answer?, a detailed solution for The standard plasticity chart to classify fine grained soils is shown in the figure below.What does the area marked X represent?a)Sit of low plasticityb)Clay of high plasticityc)Organic soil of medium plasticityd)Clay of intermediate plasticityCorrect answer is option 'D'. Can you explain this answer? has been provided alongside types of The standard plasticity chart to classify fine grained soils is shown in the figure below.What does the area marked X represent?a)Sit of low plasticityb)Clay of high plasticityc)Organic soil of medium plasticityd)Clay of intermediate plasticityCorrect answer is option 'D'. Can you explain this answer? theory, EduRev gives you an
ample number of questions to practice The standard plasticity chart to classify fine grained soils is shown in the figure below.What does the area marked X represent?a)Sit of low plasticityb)Clay of high plasticityc)Organic soil of medium plasticityd)Clay of intermediate plasticityCorrect answer is option 'D'. Can you explain this answer? tests, examples and also practice Civil Engineering (CE) tests.

|
Explore Courses for Civil Engineering (CE) exam
|

|
Suggested Free Tests
Signup for Free!
Signup to see your scores go up within 7 days! Learn & Practice with 1000+ FREE Notes, Videos & Tests.


