


Banking Exams Exam > Banking Exams Questions > Directions:The following line graph shows the... Start Learning for Free
Directions: The following line graph shows the data of rate of interests provided by company X and Y in the following 5 years, 2020, 2021, 2022, 2023,and 2024. (all the interest rates are simple interest rate)
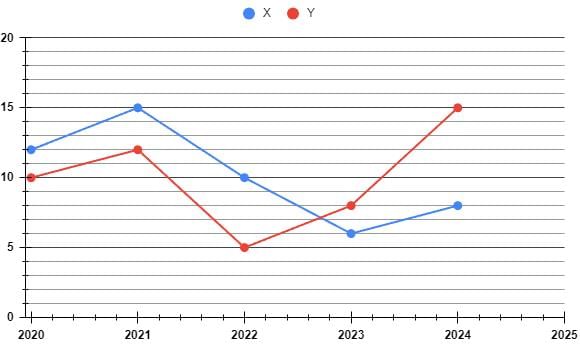
In 2023, a part of Rs. 45,000 is invested in company X and the rest was invested in company Y for 1 year. If the total interest received is Rs. 3100, then what was the amount invested in company X?
- a)Rs. 20000
- b)Rs. 25000
- c)Rs. 15000
- d)Rs. 30000
Correct answer is option 'B'. Can you explain this answer?

Verified Answer
Directions:The following line graph shows the data of rate of interest...
Given:
In 2023, a part of Rs. 45,000 is invested in company X
The rest was invested in company Y for 1 year
The total interest received is Rs. 3100
Concept Used:
Simple interest (SI) = (P × R × T)/100
Where, P = principal amount, R = rate of interest, and T = time of investment
Calculation:
Let, Rs. a is invested in X and Rs. (45000 - a) is invested in Y
According to the question,
(6a/100) + (45000 - a) × 8/100 = 3100
⇒ 6a + 360000 - 8a = 310000
⇒ 2a = 50000
⇒ a = 25000
∴ The amount invested in X was Rs. 25000
 | Explore Courses for Banking Exams exam |
Top Courses for Banking ExamsView all


Top Courses for Banking Exams
Question Description
Directions:The following line graph shows the data of rate of interests provided by company X and Y in the following 5 years, 2020, 2021, 2022, 2023,and 2024. (all the interest rates are simple interest rate)In 2023, a part of Rs. 45,000 is invested in company X and the rest was invested in company Y for 1 year. If the total interest received is Rs. 3100, then what was the amount invested in company X?a)Rs. 20000b)Rs. 25000c)Rs. 15000d)Rs. 30000Correct answer is option 'B'. Can you explain this answer? for Banking Exams 2026 is part of Banking Exams preparation. The Question and answers have been prepared according to the Banking Exams exam syllabus. Information about Directions:The following line graph shows the data of rate of interests provided by company X and Y in the following 5 years, 2020, 2021, 2022, 2023,and 2024. (all the interest rates are simple interest rate)In 2023, a part of Rs. 45,000 is invested in company X and the rest was invested in company Y for 1 year. If the total interest received is Rs. 3100, then what was the amount invested in company X?a)Rs. 20000b)Rs. 25000c)Rs. 15000d)Rs. 30000Correct answer is option 'B'. Can you explain this answer? covers all topics & solutions for Banking Exams 2026 Exam. Find important definitions, questions, meanings, examples, exercises and tests below for Directions:The following line graph shows the data of rate of interests provided by company X and Y in the following 5 years, 2020, 2021, 2022, 2023,and 2024. (all the interest rates are simple interest rate)In 2023, a part of Rs. 45,000 is invested in company X and the rest was invested in company Y for 1 year. If the total interest received is Rs. 3100, then what was the amount invested in company X?a)Rs. 20000b)Rs. 25000c)Rs. 15000d)Rs. 30000Correct answer is option 'B'. Can you explain this answer?.
Directions:The following line graph shows the data of rate of interests provided by company X and Y in the following 5 years, 2020, 2021, 2022, 2023,and 2024. (all the interest rates are simple interest rate)In 2023, a part of Rs. 45,000 is invested in company X and the rest was invested in company Y for 1 year. If the total interest received is Rs. 3100, then what was the amount invested in company X?a)Rs. 20000b)Rs. 25000c)Rs. 15000d)Rs. 30000Correct answer is option 'B'. Can you explain this answer? for Banking Exams 2026 is part of Banking Exams preparation. The Question and answers have been prepared according to the Banking Exams exam syllabus. Information about Directions:The following line graph shows the data of rate of interests provided by company X and Y in the following 5 years, 2020, 2021, 2022, 2023,and 2024. (all the interest rates are simple interest rate)In 2023, a part of Rs. 45,000 is invested in company X and the rest was invested in company Y for 1 year. If the total interest received is Rs. 3100, then what was the amount invested in company X?a)Rs. 20000b)Rs. 25000c)Rs. 15000d)Rs. 30000Correct answer is option 'B'. Can you explain this answer? covers all topics & solutions for Banking Exams 2026 Exam. Find important definitions, questions, meanings, examples, exercises and tests below for Directions:The following line graph shows the data of rate of interests provided by company X and Y in the following 5 years, 2020, 2021, 2022, 2023,and 2024. (all the interest rates are simple interest rate)In 2023, a part of Rs. 45,000 is invested in company X and the rest was invested in company Y for 1 year. If the total interest received is Rs. 3100, then what was the amount invested in company X?a)Rs. 20000b)Rs. 25000c)Rs. 15000d)Rs. 30000Correct answer is option 'B'. Can you explain this answer?.
Solutions for Directions:The following line graph shows the data of rate of interests provided by company X and Y in the following 5 years, 2020, 2021, 2022, 2023,and 2024. (all the interest rates are simple interest rate)In 2023, a part of Rs. 45,000 is invested in company X and the rest was invested in company Y for 1 year. If the total interest received is Rs. 3100, then what was the amount invested in company X?a)Rs. 20000b)Rs. 25000c)Rs. 15000d)Rs. 30000Correct answer is option 'B'. Can you explain this answer? in English & in Hindi are available as part of our courses for Banking Exams. Download more important topics, notes, lectures and mock test series for Banking Exams Exam by signing up for free.
Here you can find the meaning of Directions:The following line graph shows the data of rate of interests provided by company X and Y in the following 5 years, 2020, 2021, 2022, 2023,and 2024. (all the interest rates are simple interest rate)In 2023, a part of Rs. 45,000 is invested in company X and the rest was invested in company Y for 1 year. If the total interest received is Rs. 3100, then what was the amount invested in company X?a)Rs. 20000b)Rs. 25000c)Rs. 15000d)Rs. 30000Correct answer is option 'B'. Can you explain this answer? defined & explained in the simplest way possible. Besides giving the explanation of Directions:The following line graph shows the data of rate of interests provided by company X and Y in the following 5 years, 2020, 2021, 2022, 2023,and 2024. (all the interest rates are simple interest rate)In 2023, a part of Rs. 45,000 is invested in company X and the rest was invested in company Y for 1 year. If the total interest received is Rs. 3100, then what was the amount invested in company X?a)Rs. 20000b)Rs. 25000c)Rs. 15000d)Rs. 30000Correct answer is option 'B'. Can you explain this answer?, a detailed solution for Directions:The following line graph shows the data of rate of interests provided by company X and Y in the following 5 years, 2020, 2021, 2022, 2023,and 2024. (all the interest rates are simple interest rate)In 2023, a part of Rs. 45,000 is invested in company X and the rest was invested in company Y for 1 year. If the total interest received is Rs. 3100, then what was the amount invested in company X?a)Rs. 20000b)Rs. 25000c)Rs. 15000d)Rs. 30000Correct answer is option 'B'. Can you explain this answer? has been provided alongside types of Directions:The following line graph shows the data of rate of interests provided by company X and Y in the following 5 years, 2020, 2021, 2022, 2023,and 2024. (all the interest rates are simple interest rate)In 2023, a part of Rs. 45,000 is invested in company X and the rest was invested in company Y for 1 year. If the total interest received is Rs. 3100, then what was the amount invested in company X?a)Rs. 20000b)Rs. 25000c)Rs. 15000d)Rs. 30000Correct answer is option 'B'. Can you explain this answer? theory, EduRev gives you an ample number of questions to practice Directions:The following line graph shows the data of rate of interests provided by company X and Y in the following 5 years, 2020, 2021, 2022, 2023,and 2024. (all the interest rates are simple interest rate)In 2023, a part of Rs. 45,000 is invested in company X and the rest was invested in company Y for 1 year. If the total interest received is Rs. 3100, then what was the amount invested in company X?a)Rs. 20000b)Rs. 25000c)Rs. 15000d)Rs. 30000Correct answer is option 'B'. Can you explain this answer? tests, examples and also practice Banking Exams tests.
| Explore Courses for Banking Exams exam |
Top Courses for Banking Exams
Explore Courses
Signup for Free!
Signup to see your scores go up within 7 days! Learn & Practice with 1000+ FREE Notes, Videos & Tests.


