


Class 8 Exam > Class 8 Questions > The line graphshows the yearly sales figure f... Start Learning for Free
The line graph shows the yearly sales figure for a manufacturing company. From the graph, what were the sales in 2004?
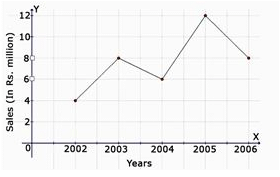
- a)Rs 5 millions
- b)Rs 3 millions
- c)Rs 4 millions
- d)Rs 6 millions
Correct answer is option 'D'. Can you explain this answer?

 | Explore Courses for Class 8 exam |
Top Courses for Class 8View all


Top Courses for Class 8
Question Description
The line graphshows the yearly sales figure for a manufacturing company. From the graph, what were the sales in 2004?a)Rs 5 millionsb)Rs 3 millionsc)Rs 4 millionsd)Rs 6 millionsCorrect answer is option 'D'. Can you explain this answer? for Class 8 2026 is part of Class 8 preparation. The Question and answers have been prepared according to the Class 8 exam syllabus. Information about The line graphshows the yearly sales figure for a manufacturing company. From the graph, what were the sales in 2004?a)Rs 5 millionsb)Rs 3 millionsc)Rs 4 millionsd)Rs 6 millionsCorrect answer is option 'D'. Can you explain this answer? covers all topics & solutions for Class 8 2026 Exam. Find important definitions, questions, meanings, examples, exercises and tests below for The line graphshows the yearly sales figure for a manufacturing company. From the graph, what were the sales in 2004?a)Rs 5 millionsb)Rs 3 millionsc)Rs 4 millionsd)Rs 6 millionsCorrect answer is option 'D'. Can you explain this answer?.
The line graphshows the yearly sales figure for a manufacturing company. From the graph, what were the sales in 2004?a)Rs 5 millionsb)Rs 3 millionsc)Rs 4 millionsd)Rs 6 millionsCorrect answer is option 'D'. Can you explain this answer? for Class 8 2026 is part of Class 8 preparation. The Question and answers have been prepared according to the Class 8 exam syllabus. Information about The line graphshows the yearly sales figure for a manufacturing company. From the graph, what were the sales in 2004?a)Rs 5 millionsb)Rs 3 millionsc)Rs 4 millionsd)Rs 6 millionsCorrect answer is option 'D'. Can you explain this answer? covers all topics & solutions for Class 8 2026 Exam. Find important definitions, questions, meanings, examples, exercises and tests below for The line graphshows the yearly sales figure for a manufacturing company. From the graph, what were the sales in 2004?a)Rs 5 millionsb)Rs 3 millionsc)Rs 4 millionsd)Rs 6 millionsCorrect answer is option 'D'. Can you explain this answer?.
Solutions for The line graphshows the yearly sales figure for a manufacturing company. From the graph, what were the sales in 2004?a)Rs 5 millionsb)Rs 3 millionsc)Rs 4 millionsd)Rs 6 millionsCorrect answer is option 'D'. Can you explain this answer? in English & in Hindi are available as part of our courses for Class 8. Download more important topics, notes, lectures and mock test series for Class 8 Exam by signing up for free.
Here you can find the meaning of The line graphshows the yearly sales figure for a manufacturing company. From the graph, what were the sales in 2004?a)Rs 5 millionsb)Rs 3 millionsc)Rs 4 millionsd)Rs 6 millionsCorrect answer is option 'D'. Can you explain this answer? defined & explained in the simplest way possible. Besides giving the explanation of The line graphshows the yearly sales figure for a manufacturing company. From the graph, what were the sales in 2004?a)Rs 5 millionsb)Rs 3 millionsc)Rs 4 millionsd)Rs 6 millionsCorrect answer is option 'D'. Can you explain this answer?, a detailed solution for The line graphshows the yearly sales figure for a manufacturing company. From the graph, what were the sales in 2004?a)Rs 5 millionsb)Rs 3 millionsc)Rs 4 millionsd)Rs 6 millionsCorrect answer is option 'D'. Can you explain this answer? has been provided alongside types of The line graphshows the yearly sales figure for a manufacturing company. From the graph, what were the sales in 2004?a)Rs 5 millionsb)Rs 3 millionsc)Rs 4 millionsd)Rs 6 millionsCorrect answer is option 'D'. Can you explain this answer? theory, EduRev gives you an ample number of questions to practice The line graphshows the yearly sales figure for a manufacturing company. From the graph, what were the sales in 2004?a)Rs 5 millionsb)Rs 3 millionsc)Rs 4 millionsd)Rs 6 millionsCorrect answer is option 'D'. Can you explain this answer? tests, examples and also practice Class 8 tests.
| Explore Courses for Class 8 exam |
Top Courses for Class 8
Explore Courses
Signup for Free!
Signup to see your scores go up within 7 days! Learn & Practice with 1000+ FREE Notes, Videos & Tests.


