Class 9 Exam > Class 9 Questions > A driver of a car travelling at 52kmh-1 appli...
Start Learning for Free
A driver of a car travelling at 52kmh-1 applies the brakes and accelerates uniformly in the opposite direction.the car stops in 5s .another driver going at 3km h-1 in another car applies ?his brakes slowly and stops in 1o s. on the same graph paper plot the speed versus time graphs for the two cars . which of the two cars travelled farther after the brakes were applied?
Verified Answer
A driver of a car travelling at 52kmh-1 applies the brakes and acceler...
Ans.
Initial speed of car A = 52 km/hr
Time at which the car A comes to a stop = 5 s
Initial speed of car B = 34 km/h
Time at which the car B comes to rest = 10 s
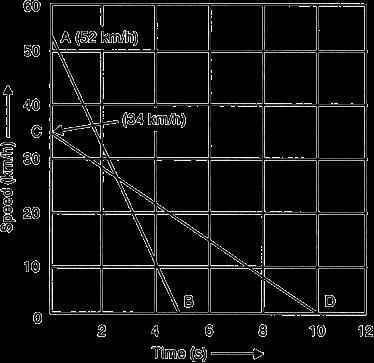
Speed versus time graph for two cars
:

In Fig. AB and CD are the speed-time graphs for the two cars whose initial speeds are 52 km/h and , respectively.
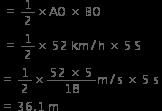
Distance covered by first car before coming to rest is equal to Are of traingle AOB.

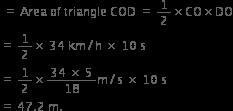
Distance covered by the second car before coming to rest is,

Thus, the second car travels farther than the first car after the brakes are applied.
 This question is part of UPSC exam. View all Class 9 courses
Most Upvoted Answer
A driver of a car travelling at 52kmh-1 applies the brakes and acceler...
Speed versus Time Graphs for the Two Cars
To compare the distances traveled by the two cars after the brakes were applied, we can plot the speed versus time graphs for both cars.
Car A:
Car A was initially traveling at a speed of 52 km/h and then applied the brakes, decelerating uniformly. The car comes to a complete stop in 5 seconds.
Let's plot the speed versus time graph for Car A:
- The initial speed of Car A is 52 km/h, which is equivalent to 14.44 m/s.
- The final speed of Car A is 0 m/s.
- The time taken for Car A to come to a stop is 5 seconds.
The graph for Car A would show a straight line starting at 14.44 m/s and decreasing uniformly to 0 m/s over a period of 5 seconds.
Car B:
Car B was initially traveling at a speed of 3 km/h and then applied the brakes slowly, decelerating uniformly. The car comes to a complete stop in 10 seconds.
Let's plot the speed versus time graph for Car B:
- The initial speed of Car B is 3 km/h, which is equivalent to 0.83 m/s.
- The final speed of Car B is 0 m/s.
- The time taken for Car B to come to a stop is 10 seconds.
The graph for Car B would show a straight line starting at 0.83 m/s and decreasing uniformly to 0 m/s over a period of 10 seconds.
Comparison and Explanation:
To determine which car traveled farther after the brakes were applied, we need to consider the area under the speed versus time graph, which represents the distance traveled.
Since both cars started at the same initial speed and came to a stop, the distance traveled is directly proportional to the time taken to stop. The longer it takes for a car to stop, the farther it will travel.
In this case, Car B took 10 seconds to come to a stop, while Car A took only 5 seconds. Therefore, Car B traveled a greater distance compared to Car A after the brakes were applied.
This can be visually observed on the graph as well. The graph for Car B has a longer horizontal line segment, indicating a longer time taken to stop and hence a greater distance traveled.
In conclusion, Car B traveled farther after the brakes were applied compared to Car A.
Community Answer
A driver of a car travelling at 52kmh-1 applies the brakes and acceler...
Nice job but I have question to you how to create the questions in photo and how to write here easily can you say something about this
Attention Class 9 Students!
To make sure you are not studying endlessly, EduRev has designed Class 9 study material, with Structured Courses, Videos, & Test Series. Plus get personalized analysis, doubt solving and improvement plans to achieve a great score in Class 9.

|
Explore Courses for Class 9 exam
|

|
Similar Class 9 Doubts
A driver of a car travelling at 52kmh-1 applies the brakes and accelerates uniformly in the opposite direction.the car stops in 5s .another driver going at 3km h-1 in another car applies ?his brakes slowly and stops in 1o s. on the same graph paper plot the speed versus time graphs for the two cars . which of the two cars travelled farther after the brakes were applied?
Question Description
A driver of a car travelling at 52kmh-1 applies the brakes and accelerates uniformly in the opposite direction.the car stops in 5s .another driver going at 3km h-1 in another car applies ?his brakes slowly and stops in 1o s. on the same graph paper plot the speed versus time graphs for the two cars . which of the two cars travelled farther after the brakes were applied? for Class 9 2024 is part of Class 9 preparation. The Question and answers have been prepared according to the Class 9 exam syllabus. Information about A driver of a car travelling at 52kmh-1 applies the brakes and accelerates uniformly in the opposite direction.the car stops in 5s .another driver going at 3km h-1 in another car applies ?his brakes slowly and stops in 1o s. on the same graph paper plot the speed versus time graphs for the two cars . which of the two cars travelled farther after the brakes were applied? covers all topics & solutions for Class 9 2024 Exam. Find important definitions, questions, meanings, examples, exercises and tests below for A driver of a car travelling at 52kmh-1 applies the brakes and accelerates uniformly in the opposite direction.the car stops in 5s .another driver going at 3km h-1 in another car applies ?his brakes slowly and stops in 1o s. on the same graph paper plot the speed versus time graphs for the two cars . which of the two cars travelled farther after the brakes were applied?.
A driver of a car travelling at 52kmh-1 applies the brakes and accelerates uniformly in the opposite direction.the car stops in 5s .another driver going at 3km h-1 in another car applies ?his brakes slowly and stops in 1o s. on the same graph paper plot the speed versus time graphs for the two cars . which of the two cars travelled farther after the brakes were applied? for Class 9 2024 is part of Class 9 preparation. The Question and answers have been prepared according to the Class 9 exam syllabus. Information about A driver of a car travelling at 52kmh-1 applies the brakes and accelerates uniformly in the opposite direction.the car stops in 5s .another driver going at 3km h-1 in another car applies ?his brakes slowly and stops in 1o s. on the same graph paper plot the speed versus time graphs for the two cars . which of the two cars travelled farther after the brakes were applied? covers all topics & solutions for Class 9 2024 Exam. Find important definitions, questions, meanings, examples, exercises and tests below for A driver of a car travelling at 52kmh-1 applies the brakes and accelerates uniformly in the opposite direction.the car stops in 5s .another driver going at 3km h-1 in another car applies ?his brakes slowly and stops in 1o s. on the same graph paper plot the speed versus time graphs for the two cars . which of the two cars travelled farther after the brakes were applied?.
Solutions for A driver of a car travelling at 52kmh-1 applies the brakes and accelerates uniformly in the opposite direction.the car stops in 5s .another driver going at 3km h-1 in another car applies ?his brakes slowly and stops in 1o s. on the same graph paper plot the speed versus time graphs for the two cars . which of the two cars travelled farther after the brakes were applied? in English & in Hindi are available as part of our courses for Class 9.
Download more important topics, notes, lectures and mock test series for Class 9 Exam by signing up for free.
Here you can find the meaning of A driver of a car travelling at 52kmh-1 applies the brakes and accelerates uniformly in the opposite direction.the car stops in 5s .another driver going at 3km h-1 in another car applies ?his brakes slowly and stops in 1o s. on the same graph paper plot the speed versus time graphs for the two cars . which of the two cars travelled farther after the brakes were applied? defined & explained in the simplest way possible. Besides giving the explanation of
A driver of a car travelling at 52kmh-1 applies the brakes and accelerates uniformly in the opposite direction.the car stops in 5s .another driver going at 3km h-1 in another car applies ?his brakes slowly and stops in 1o s. on the same graph paper plot the speed versus time graphs for the two cars . which of the two cars travelled farther after the brakes were applied?, a detailed solution for A driver of a car travelling at 52kmh-1 applies the brakes and accelerates uniformly in the opposite direction.the car stops in 5s .another driver going at 3km h-1 in another car applies ?his brakes slowly and stops in 1o s. on the same graph paper plot the speed versus time graphs for the two cars . which of the two cars travelled farther after the brakes were applied? has been provided alongside types of A driver of a car travelling at 52kmh-1 applies the brakes and accelerates uniformly in the opposite direction.the car stops in 5s .another driver going at 3km h-1 in another car applies ?his brakes slowly and stops in 1o s. on the same graph paper plot the speed versus time graphs for the two cars . which of the two cars travelled farther after the brakes were applied? theory, EduRev gives you an
ample number of questions to practice A driver of a car travelling at 52kmh-1 applies the brakes and accelerates uniformly in the opposite direction.the car stops in 5s .another driver going at 3km h-1 in another car applies ?his brakes slowly and stops in 1o s. on the same graph paper plot the speed versus time graphs for the two cars . which of the two cars travelled farther after the brakes were applied? tests, examples and also practice Class 9 tests.

|
Explore Courses for Class 9 exam
|

|
Suggested Free Tests
Test: The Fundamental Unit of Life- Case Based Type Questions- 1
Test | 10 questions
Signup for Free!
Signup to see your scores go up within 7 days! Learn & Practice with 1000+ FREE Notes, Videos & Tests.


