Chapter - Data Flow Diagrams, PPT, BSAD, Semester, Engineering - Computer Science Engineering (CSE) PDF Download

DATA FLOW DIAGRAMS (DFD)
Sources and Sinks:
–Define System Boundaries
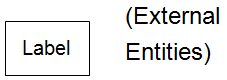
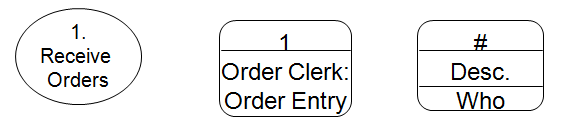
Process (transformation)
–Transforms data - no detail of how the transformation is done
–Inputs and Outputs
–Manual / Automated
–Process #, Brief descriptive label (action verb and object clause)
Data Flow Diagrams concept ---------------------------Next Slide -----------------------
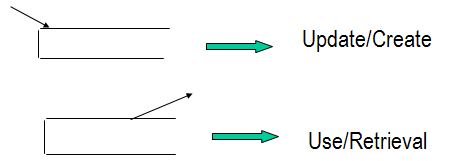
Data Store:
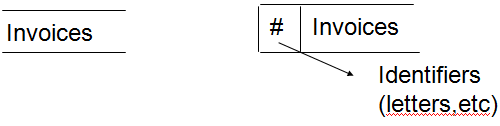
–only processes can connect to data stores
–A store is passive, process initiates flows
Data Flow:

Data Flow Diagrams concept ---------------------------Next Slide -----------------------
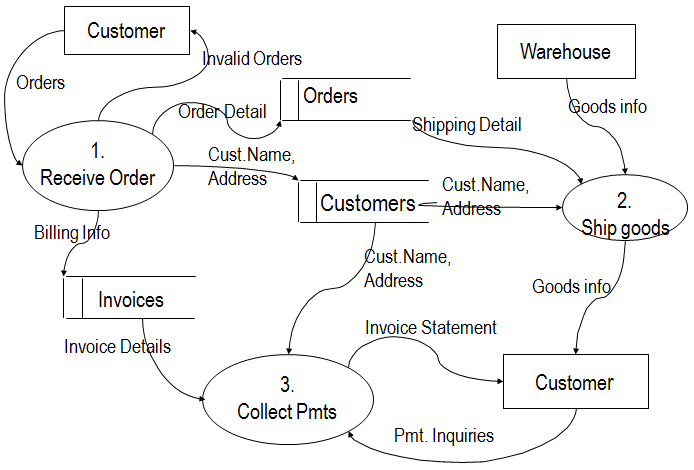
DFD Example
Data Flow Diagrams concept ---------------------------Next Slide -----------------------
Data Store:
May be a fundamental user requirement or an implementation store placed there for convenience.
Data Flow Diagrams concept ---------------------------Next Slide -----------------------
Naming data Flows:

For Essential model name should be implementation free
e.g. Course Request Form vs. Form23
Data Flow Diagrams concept ---------------------------Next Slide -----------------------
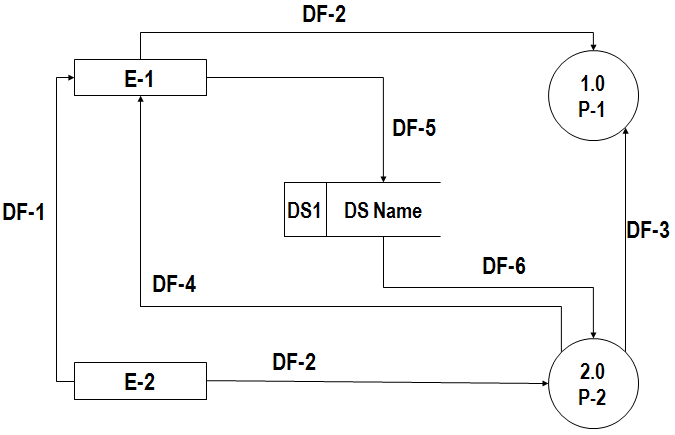
Common DFD Errors
Data Flow Diagrams concept ---------------------------Next Slide -----------------------
Common DFD Errors:
–Process1 has inputs but produces no outputs. This is called a black hole
–Process 2 produces outputs but receives no inputs. This is called a miracle
–Process 3 has inputs and outputs ; however the inputs are not sufficient to produce the outputs. This is called a gray hole.
Data Flow Diagrams concept ---------------------------Next Slide -----------------------
DFD Errors
Data Flow Diagrams concept ---------------------------Next Slide -----------------------
The Data Flow Packet Concept 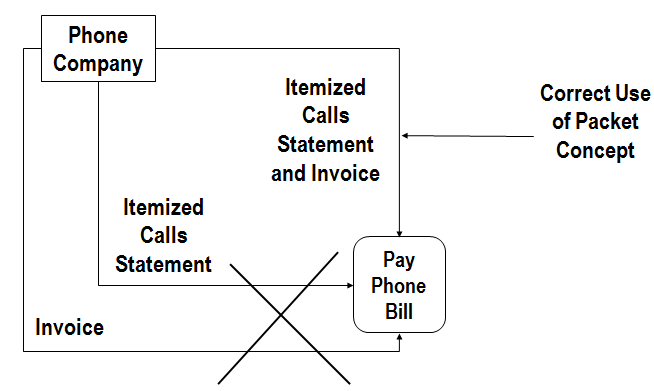
Data Flow Diagrams concept ---------------------------Next Slide -----------------------
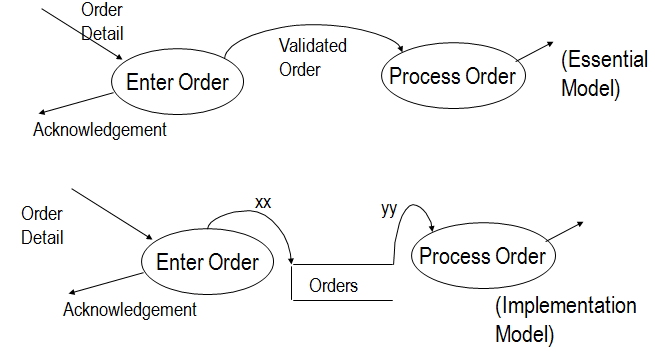
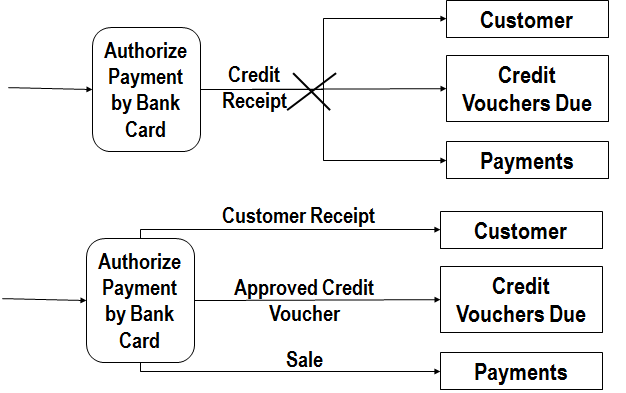
Diverging Data Flows
Diverging data flows are implementation oriented and should be avoided on essential DFDs
Data Flow Diagrams concept ---------------------------Next Slide -----------------------
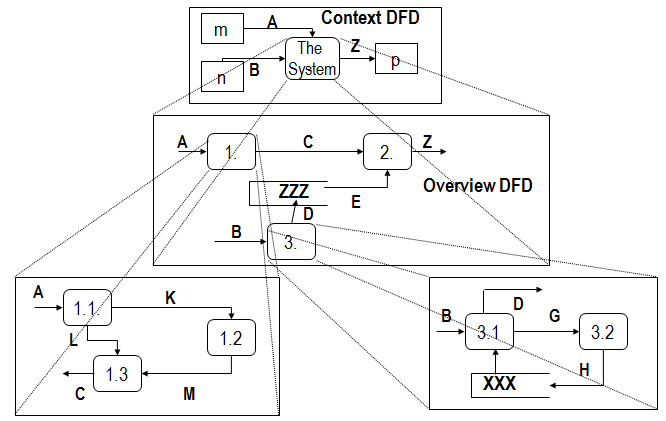
The Explosion Approach to drawing DFDs:
As suggested by DeMarco and others, this diagramming technique requires the analyst to draw multiple DFDs, each one exploding from a single process on another diagram, until the system is completely modeled
Data Flow Diagrams concept ---------------------------Next Slide -----------------------
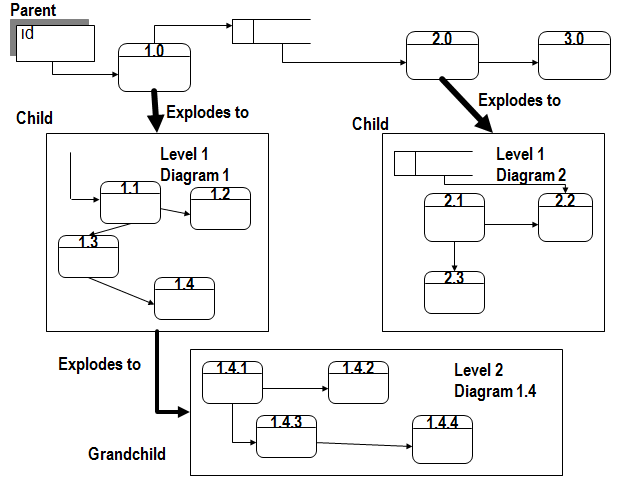
Functional Decomposition and Leveled DFDs
Data Flow Diagrams concept ---------------------------Next Slide -----------------------
TOP - DOWN analysis & functional decomposition 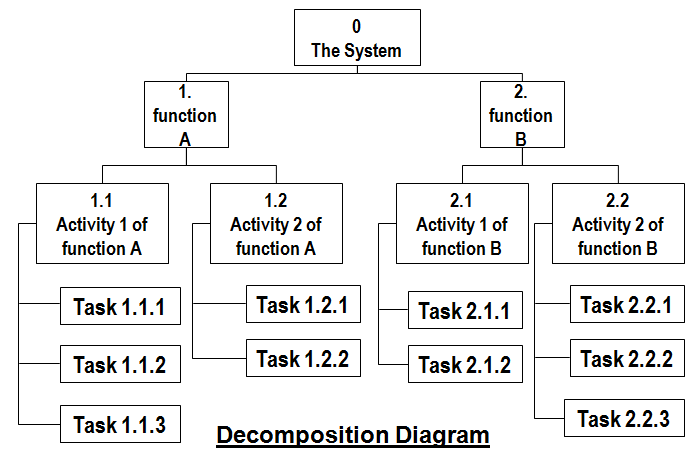
Data Flow Diagrams concept ---------------------------Next Slide -----------------------
Levelled Set of DFDs
•How many levels - not > 9 processes in single DFD
•Different parts of system can have different level of detail
•Consistency (Balancing) - inflow and outflow to process must correspond in next level DFD
•External entities,data stores,parent processes can, but need not be repeated in child diagram
•Data Stores at different levels - show data store at the highest level where it first serves as an interface between two or more processes
Top- Down Analysis and Functional Decomposition
Data Flow Diagrams concept ---------------------------Next Slide -----------------------
Carson-Plymouth Medical Devices (CPMD), as assembler of sophisticated medical products, must maintain a ready supply of high-quality components to manufacture its products. To achieve this goal, CPMD’s purchasing department checks inventory levels each day by reviewing the inventory items stock list. When the quantity-on-hand of a particular item reaches its economic reorder point, CPMD’s purchasing department places a purchase order with its supplier (supplier data is accessed through the supplier file) for that component and files a copy in the purchase order file. When a supplier delivers a shipment along with a bill of lading, shipping and receiving (S/R) receives the shipment by performing a three-step process. First, the S/R clerk verifies the shipment by accessing a copy of the purchase order and comparing it to the bill of lading. If a received item appears on the purchase order and the bill of lading, the verified bill of lading and received items are passed on to Inspection. Otherwise, the S/R clerk generates a notice of shipment error, which is sent to the supplier.
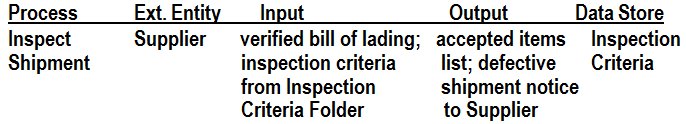
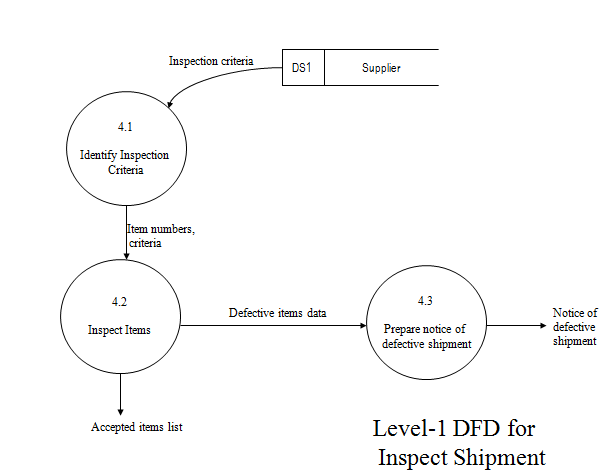
Next, the inspector inspects the valid shipment items by accessing the quality criteria, from the inspection criteria folder. If the item meets all the quality criteria, the inspector adds it to an accepted items list, which is forwarded to the inventory clerk. If an item does not pass inspection, the inspector creates a notice of defective shipment, which is sent to the supplier along with the defective items.
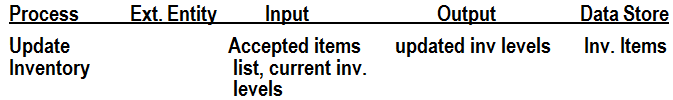
Finally, the inventory clerk updates the inventory items list by adding the current-on-hand quantity, reflecting an updated quantity.
Data Flow Diagrams concept ---------------------------Next Slide -----------------------
Carson-Plymouth Medical Devices (CPMD), as assembler of sophisticated medical products, must maintain a ready supply of high-quality components to manufacture its products. To achieve this goal, CPMD’s purchasing department checks inventory levels each day by reviewing the INVENTORY ITEMS STOCK list. When the quantity-on-hand of a particular item reaches its economic reorder point, CPMD’s purchasing department places a purchase order with its supplier (supplier data is accessed through the SUPPLIER file) for that component and files a copy in the PURCHASE ORDER file. When a supplier delivers a shipment along with a bill of lading, shipping and receiving (S/R) receives the shipment by performing a three-step process. First, the S/R clerk verifies the shipment by accessing a copy of the purchase order and comparing it to the bill of lading. If a received item appears on the purchase order and the bill of lading, the verified bill of lading and received items are passed on to Inspection. Otherwise, the S/R clerk generates a notice of shipment error, which is sent to the supplier.
Next, the inspector inspects the valid shipment items by accessing the quality criteria, from the INSPECTION CRITERIA folder. If the item meets all the quality criteria, the inspector adds it to an accepted items list, which is forwarded to the inventory clerk. If an item does not pass inspection, the inspector creates a notice of defective shipment, which is sent to the supplier along with the defective items.
Finally, the inventory clerk updates the INVENTORY ITEMS list by adding the current-on-hand quantity, reflecting an updated quantity.
Data Flow Diagrams concept ---------------------------Next Slide -----------------------
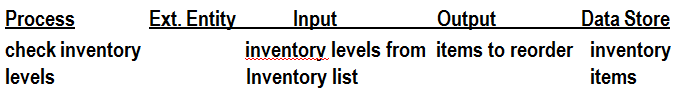
Carson-Plymouth Medical Devices (CPMD), as assembler of sophisticated medical products, must maintain a ready supply of high-quality components to manufacture its products. To achieve this goal, CPMD’s purchasing department checks inventory levels each day by reviewing the INVENTORY ITEMS stock list.
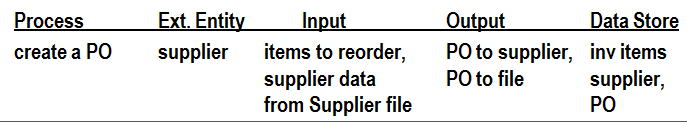
When the quantity-on-hand of a particular item reaches its economic reorder point, CPMD’s purchasing department places a purchase order with its supplier (supplier data is accessed through the SUPPLIER file) for that component and files a copy in the PURCHASE ORDER file.
Data Flow Diagrams concept ---------------------------Next Slide -----------------------
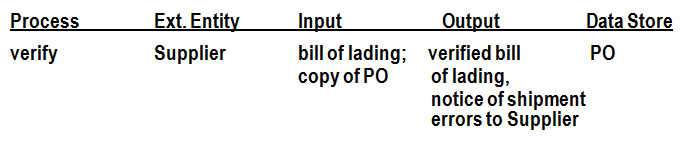
When a supplier delivers a shipment along with a bill of lading, shipping and receiving (S/R) receives the shipment by performing a three-step process. First, the S/R clerk verifies the shipment by accessing a copy of the purchase order and comparing it to the bill of lading. If a received item appears on the purchase order and the bill of lading, the verified bill of lading and received items are passed on to Inspection. Otherwise, the S/R clerk generates a notice of shipment error, which is sent to the supplier.
Data Flow Diagrams concept ---------------------------Next Slide -----------------------
Next, the inspector inspects the valid shipment items by accessing the quality criteria, from the INSPECTION CRITERIA folder. If the item meets all the quality criteria, the inspector adds it to an accepted items list, which is forwarded to the inventory clerk. If an item does not pass inspection, the inspector creates a notice of defective shipment, which is sent to the supplier along with the defective items.
Data Flow Diagrams concept ---------------------------Next Slide -----------------------
Finally, the inventory clerk updates the INVENTORY ITEMS list by adding the current-on-hand quantity, reflecting an updated quantity
Data Flow Diagrams concept ---------------------------Next Slide -----------------------
Data Flow Diagrams concept ---------------------------Next Slide -----------------------
Data Flow Diagrams concept ---------------------------Next Slide -----------------------
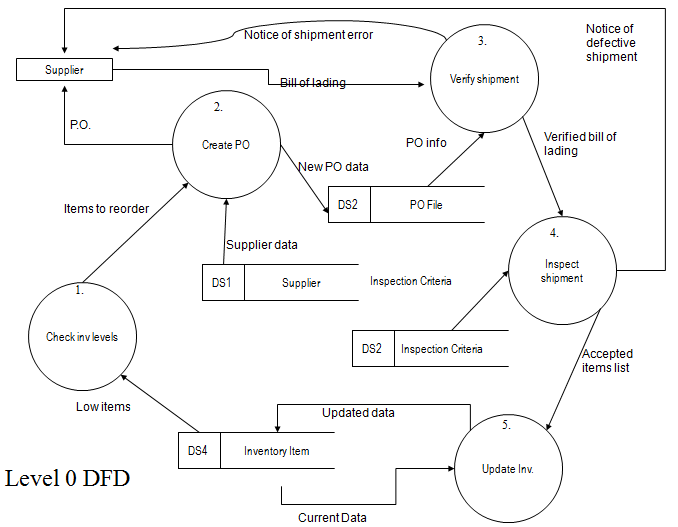
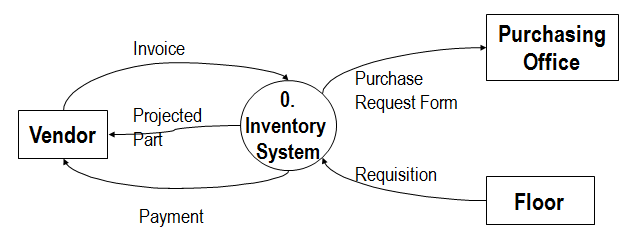
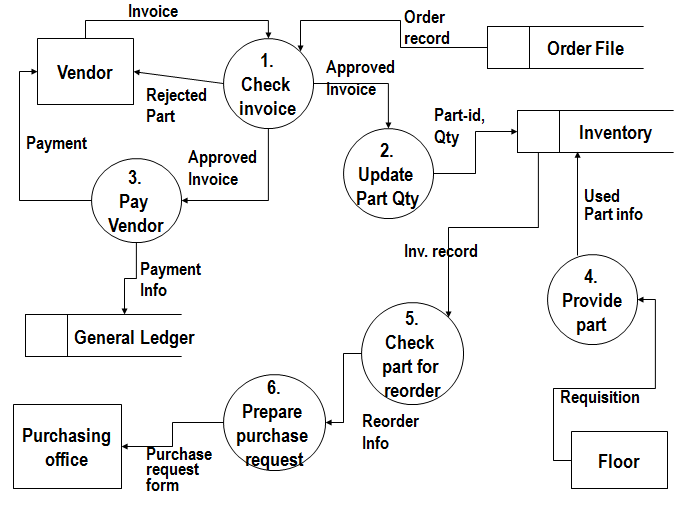
Context and level 0 DFD
When parts are received from vendors, they are accompanied by an invoice. Mrs Gauron in the Receiving Dept checks the invoice against the orders file to be certain that the correct parts were delivered. If the parts were not ordered or the order was incorrectly filled, parts are returned. If the parts are correct, the inventory file is updated to reflect the new quantity of these parts. This is done by increasing the data element quantity-on-hand by the quantity-record for the part-id . Mrs Gauron then prepares the payment for the vendor. She also enters the payment transaction in the general ledger, which is maintained as the bound accounting ledger. A worker on the factory floor who needs a part requests it by submitting a requisition to the parts clerk. The information on this form is used to update the inventory file. Each week the parts clerk uses the inventory file to prepare a report listing all parts whose quantity- on- hand has fallen below the reorder point. For parts listed on the report, a purchase request form is prepared and sent to the purchasing office.
[ Hint: do not confuse the processes being performed with the people who perform them ]
Data Flow Diagrams concept ---------------------------Next Slide -----------------------
Context level DFD
Data Flow Diagrams concept ---------------------------Next Slide -----------------------
Data Flow Diagrams concept ---------------------------Next Slide -----------------------
Delta Products Corporation is a major vendor of office supplies, furniture and equipment. Delta’s sales representatives call on customers to take orders. The sales rep write up the orders and turn them in to a sales order processing (SOP) clerk at the regional center. If the order items are in stock, the SOP clerk prepares a picking slip and packing list for each order. If any of the ordered items are out of stock, the SOP clerk completes an out of stock Notice forms, which notes the number of customer requiring the items and forwards it to Purchasing. A Purchasing clerk then completes a purchase order,which is mailed to a supplier. The SOP clerk notes back-ordered items on the customer’s order and forwards a copy of annotated customer order to Accounts receivable, where a A/R clerk prepares an invoice and sends it to the customer. The SOP clerk also forwards a picking slip and packing list to the warehouse, where stock price pickers fill the order,placing ordered items into boxes alongwith the packing list. The boxed items and packing list are held for delivery, usually via UPS.
•Context Diagram
•Level 0 DFD
•Level 1 DFD for functions related to the sales-order processing clerk
Data Flow Diagrams concept ---------------------------Next Slide -----------------------
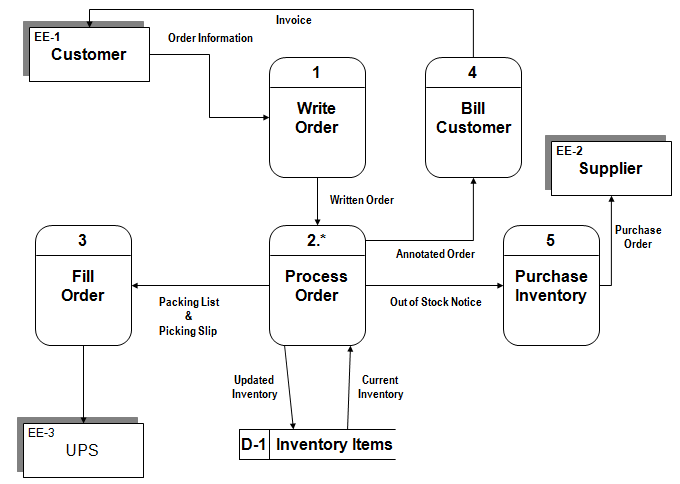
Level 0 DFD for Delta Products’ Order Fulfillment System
Data Flow Diagrams concept ---------------------------Next Slide -----------------------
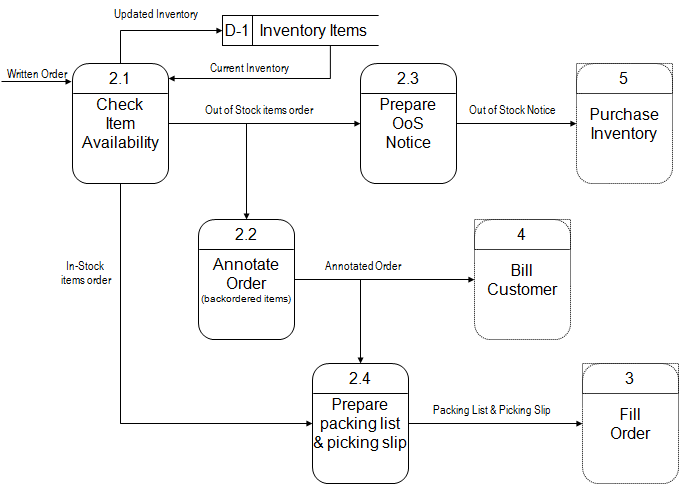
Level 1 Process 2.0 - Process Order
FAQs on Chapter - Data Flow Diagrams, PPT, BSAD, Semester, Engineering - Computer Science Engineering (CSE)
| 1. What is a Data Flow Diagram (DFD)? |  |
| 2. How can Data Flow Diagrams be helpful in system analysis? | |
| 3. What are the different levels of Data Flow Diagrams? | |
| 4. What is the purpose of using PPT in presentations? | |
| 5. What does BSAD stand for in the context of computer science engineering? | |


Top Courses for Computer Science Engineering (CSE)
video lectures
,ppt
,Chapter - Data Flow Diagrams
,study material
,BSAD
,Extra Questions
,PPT
,Free
,BSAD
,Summary
,Semester
,Engineering - Computer Science Engineering (CSE)
,Important questions
,Engineering - Computer Science Engineering (CSE)
,Exam
,MCQs
,practice quizzes
,Chapter - Data Flow Diagrams
,Semester
,Chapter - Data Flow Diagrams
,past year papers
,Sample Paper
,Viva Questions
,PPT
,shortcuts and tricks
,Semester Notes
,Engineering - Computer Science Engineering (CSE)
,Objective type Questions
,PPT
,Semester
,mock tests for examination
,BSAD
,Previous Year Questions with Solutions
;


Chapter - Data Flow Diagrams, PPT, BSAD, Semester, Engineering Free PDF Download
Importance of Chapter - Data Flow Diagrams, PPT, BSAD, Semester, Engineering
Chapter - Data Flow Diagrams, PPT, BSAD, Semester, Engineering Notes
Chapter - Data Flow Diagrams, PPT, BSAD, Semester, Engineering Computer Science Engineering (CSE) Questions
Study Chapter - Data Flow Diagrams, PPT, BSAD, Semester, Engineering on the App
|
© EduRev
|
Education Revolution
|


|


