Consumer's Equilibrium and Demand (Theory of Consumer Behaviour) Class 12 Economics
Demand
Demand for a commodity refers to the quantity that a consumer is both willing and able to buy, given the prices of the goods and their personal tastes and preferences, other things remaining constant.
If the price of the commodity changes, the consumer's demand for it will also change.

Demand Curve and the Law of Demand
Demand Function
The demand function is a mathematical representation of the relationship between the quantity demanded (X) of a good and its price (P), assuming other factors such as income and preferences remain constant. It is denoted as X = f(P).
It helps economists and analysts understand how changes in the price of a good affect the quantity demanded by consumers.
Demand Curve
The demand curve is a graphical representation of the demand function.

- The demand curve illustrates the relationship between the price of a good and the quantity demanded by consumers.
- In the graphical representation, the horizontal axis typically represents the quantity of the good, and the vertical axis represents the price.
- The demand curve typically slopes downward from left to right, reflecting the inverse relationship between price and quantity demanded. This means that if the price of the commodity rises, the consumer will demand less of it and vice-versa.
Law of Demand
The Law of Demand is a fundamental principle in economics that states, all else being equal, the quantity demanded of a good will decrease as its price increases and vice versa. In simpler terms, there is an inverse relationship between price and quantity demanded. This law is often reflected in the downward-sloping nature of the demand curve.
Other factors Affecting Demand
Several factors influence demand apart from the price of the good, including:
- prices of other goods (substitutes and complements)
- consumer income
- consumer's tastes and preferences
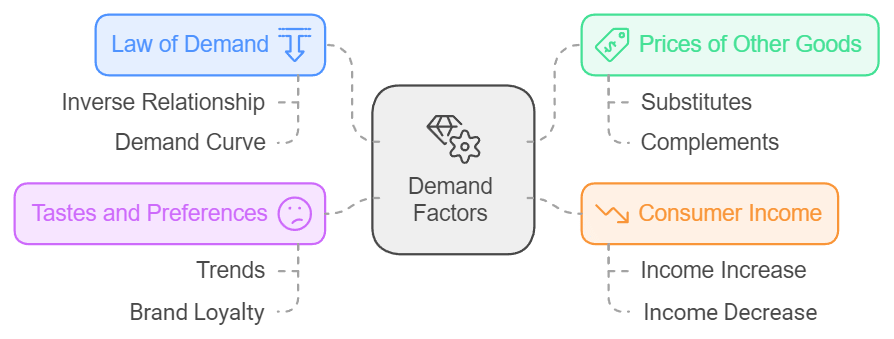
Understanding how changes in these variables impact demand is crucial for predicting consumer behaviour and market trends. For the sake of simplicity, we assume that these remain unchanged for now.
Functions
A function is a relationship between two variables, x and y, denoted as y=f(x). This relation ensures that for each value of x, there is a unique corresponding value of y. In this context, y is termed the dependent variable, as its value depends on the independent variable x.
- The demand function is denoted as X = f(P).
- It implies that the quantity demanded X is a function of price P.

Algebraic Representation
Functions can often be expressed in algebraic forms, like y = 5 + x or y = 50 - x.
- Increasing and Decreasing Functions:
Increasing Function: A function is increasing if the value of y does not decrease with an increase in x.
Decreasing Function: A function is decreasing if the value of y does not increase with an increase in x.
In the examples above, we can find out if the functions are increasing or decreasing. If the value of x is 10, the value of y is 15. But if the value of x increases to 15, the value of y would be 20. This means that it is an increasing function. Similarly, it can be found out that y = 50 - x is a decreasing function.
Graphical Representation
A graph of a function y=f(x) visually represents the function.
 Graphical representation of a function
- For an increasing function, the line would be upward-sloping like in the first figure.
- For a decreasing function, the line would be downward sloping.
- In economics, we often reverse the order, with the independent variable (e.g., price) on the vertical axis and the dependent variable (e.g., quantity) on the horizontal axis.
Deriving a Demand Curve from Indifference Curves and Budget Constraints
Consider an individual consuming bananas and mangoes with an income of M and market prices of the goods are denoted as P'1 and P'2 respectively. In Figure (a), her consumption equilibrium is at point E, where she buys quantities X1 of bananas (and a certain amount of mangoes).
Demand Curve Derivation
 Derivation of demand curve from indifference curvesPanel (b) in Figure: Plots P1 against X1, representing the first point on the demand curve for Bananas.
- Price Drop (P1 to P2): If the price of bananas drops to P1 while keeping P'2 and M constant, the budget set expands. The new equilibrium is at point D, where more bananas (and less mangoes) are purchased.
- Plotting P2 against X2: Panel (b) shows P2 against X2, giving the second point on the demand curve for bananas.
- Further Price Drop (P2 to P3): Repeating the process, a further drop in the price of bananas leads to an increase in consumption (X3).
- Plotting P3 against X3: This provides the third point on the demand curve, indicating that a drop in price results in an increase in the quantity demanded.
Explanation of Negative Slope
- Substitution Effect: A price drop leads to a substitution effect, where the consumer substitutes the now cheaper bananas for mangoes to maintain satisfaction (being on the same indifference curve), increasing demand for bananas.
- Income Effect: As the price of bananas drops, the consumer's purchasing power increases. This income effect further boosts demand for both bananas and mangoes.
Law of Demand
The Law of Demand states that all else being equal, there is a negative relation between the demand for a commodity and its price. If the price increases, demand decreases, and if the price decreases, demand rises, assuming other factors remain constant.Linear Demand
A linear demand curve is expressed as:-FormulaHere, a is the intercept, and −b is the slope of the demand curve. The slope measures the rate at which demand changes with respect to its price. If the price of the commodity increases by one unit, its demand falls by b units. At price 0, demand is a, and at the price a/b, demand is 0.Linear Demand Curve


Normal and Inferior Goods
- Normal Goods: These are goods for which demand moves in the same direction as the consumer's income. As income increases, demand rises, and as income decreases, demand falls. Most goods fall into this category.
- Inferior Goods: For inferior goods, demand moves in the opposite direction of the consumer's income. As income increases, demand for inferior goods falls, and as income decreases, demand rises. Examples include low-quality food items like coarse cereals. Goods can switch between being normal and inferior based on income levels.
Giffen goods are a special case of inferior goods where demand increases as the price of the good rises. Here. the income effect is stronger than the substitution effect, the demand for the good would be positively related to its price. Giffen goods violate the law of demand, i.e., their quantity demanded rises with the increase in price. For example, if the price of staple foods (necessities) rises, people may actually buy more of them because they can no longer afford more expensive alternatives.
Note: In the case of both inferior and Giffen goods, the substitution effect and the income effect will work in opposite directions. The demand for such a good can be inversely or positively related to its price depending on the relative strengths of these two opposing effects.

Substitutes and Complements
- Complementary Goods: These are goods consumed together, such as tea and sugar, shoes and socks, or pen and ink. An increase in the price of one complementary good (e.g., sugar) is likely to decrease the demand for the other (e.g., tea), and vice versa.
- Substitute Goods: These are goods that can replace each other, like tea and coffee. If the price of one substitute good (e.g., coffee) increases, consumers may shift to the other (e.g., tea), leading to an increase in demand for the substitute. Conversely, if the price of the substitute decreases, demand for the original good may decrease.

Shifts in the Demand Curve
We make certain assumptions when we draw the demand curve and establish the relationship between price and quantity demanded. We assume that the consumer's income, the prices of related goods, and the consumer's tastes and preferences remain unchanged. Now we lift these assumptions.
Income Changes
- Increase in income results in a rightward shift for normal goods.
- For inferior goods, an increase in income leads to a leftward shift as consumers opt for higher-quality substitutes.
Prices of Related Goods
- Increase in the price of substitute goods causes a rightward shift. For example, an increase in the price of Coca Cola would result in an increase in the quantity of demanded of Pepsi (because the quantity demanded of Coca Cola would decrease). This would result in a rightward shift in the demand curve for Pepsi.
- Increase in the price of complementary goods induces a leftward shift. For instance, if the price of milk increases, the demand for cereals would decrease.
Tastes and Preferences
- Favorable changes in preferences lead to a rightward shift.
- Unfavorable changes result in a leftward shift.
- Example: Increased preference for ice-creams in summer causes a rightward shift, while health concerns about cold-drinks lead to a leftward shift.
Shift in Demand Curve Illustration
- Panel (a) shows a leftward shift in the demand curve and panel (b) shows a rightward shift
- It must be noted that these shifts are caused by factors other than the price of the commodity.
 Shifts in Demand
Movements along the Demand Curve and Shifts in the Demand Curve
The demand for a good depends upon a number of factors such as:
- The price of the good
- Prices of related goods
- Income of the consumer
- Consumer's tastes and preferences
Only the first factor results in movements along the demand curve, while the rest results in shifting of the curve.
Movements along the Demand Curve
The demand function describes the relationship between the quantity of a good a consumer chooses and its price, other factors remaining constant. The demand curve visually represents the relationship described by the demand function.
Impact of Price Changes:
- Higher prices lead to a decrease in demand.
- Lower prices lead to an increase in demand.

Result of Price Alteration: Causes movements along the demand curve as consumers respond to price fluctuations as shown by panel (a) in the figure below.
Shift in Demand Curve:
Occurs due to changes in factors beyond the price, such as:
- Income fluctuations: Changes in consumer income affect purchasing power.
- Changes in prices of substitute or complementary goods: Alterations in the prices of related goods influencing demand.
- Shifts in consumer tastes and preferences: Changes in consumer preferences impact the demand for a specific good.
Shifts of the demand curve are shown by panel (b) below.
 Movement along a Demand Curve and Shift of a Demand Curve
Market Demand
In the preceding section, we studied the individual consumer's decision-making process and the derivation of the consumer's individual demand curve. However, understanding the collective demand, known as market demand, is crucial for comprehending overall market behaviour.
Definition
The market demand for a good at a specific price represents the total demand from all consumers combined. This aggregate demand can be derived from individual demand curves.

Derivation from Individual Demand Curves
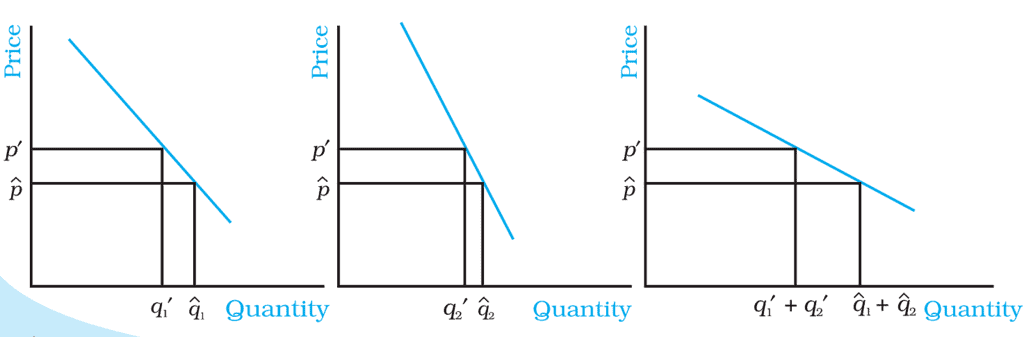 Derivation of the Market Demand Curve
 For instance, in a hypothetical scenario with only two consumers, denoted as Consumer 1 and Consumer 2, if the demand for Consumer 1 at price p′ is q1′ and for Consumer 2 is q2′, then the market demand at p′ is the sum of these individual demands (q1′+q2′). This summation principle holds for multiple consumers in the market.
Graphical Representation
Graphically, the market demand curve can be obtained by horizontally adding up individual demand curves. This technique, illustrated in the figure, is referred to as horizontal summation. It visually captures the cumulative demand at various price levels.
Example - Adding Linear Demand Curves
Consider a practical example where two consumers have linear demand curves: d1(p)=10−p and d2(p)=15−p. To derive the market demand, these individual demand curves are added. Notably, if the price exceeds 10, Consumer 1 demands zero units, and if it surpasses 15, Consumer 2 demands zero units.
Resulting Market Demand Equation:
The resulting market demand equation reflects variations in demand concerning different price ranges: 25−2p for p≤10,15−p for 10<p≤15, and 0 for p>15. This comprehensive understanding of market demand is pivotal for gauging the broader economic landscape and making informed business decisions.
|
75 videos|269 docs|46 tests
|
FAQs on Consumer's Equilibrium and Demand (Theory of Consumer Behaviour) Class 12 Economics
| 1. How can demand curves be derived from indifference curves and budget constraints? |  |
| 2. What is the difference between normal and inferior goods in terms of consumer demand? | |
| 3. How do substitutes and complements affect consumer demand? | |
| 4. What factors can cause shifts in the demand curve? | |
| 5. What is the difference between movements along the demand curve and shifts in the demand curve? | |

|
68.7K Views |

|
4.84/5 Rating |

|
Nov 24, 2024 Last updated |

|
Explore Courses for Commerce exam
|
|
Extra Questions
,ppt
,Consumer's Equilibrium and Demand (Theory of Consumer Behaviour) Class 12 Economics
,Previous Year Questions with Solutions
,past year papers
,Summary
,MCQs
,Sample Paper
,Exam
,video lectures
,shortcuts and tricks
,Consumer's Equilibrium and Demand (Theory of Consumer Behaviour) Class 12 Economics
,study material
,practice quizzes
,Semester Notes
,Free
,Consumer's Equilibrium and Demand (Theory of Consumer Behaviour) Class 12 Economics
,mock tests for examination
,Important questions
,Viva Questions
,Objective type Questions
;


Chapter Notes - Consumer's Equilibrium and Demand (Theory of Consumer Behaviour) Free PDF Download
Importance of Chapter Notes - Consumer's Equilibrium and Demand (Theory of Consumer Behaviour)
Chapter Notes - Consumer's Equilibrium and Demand (Theory of Consumer Behaviour)
Chapter Notes - Consumer's Equilibrium and Demand (Theory of Consumer Behaviour) Commerce Questions
Study Chapter Notes - Consumer's Equilibrium and Demand (Theory of Consumer Behaviour) on the App
|
© EduRev
|
Education Revolution
|


Follow Us
|


