Data Handling Chapter Notes | Mathematics Class 8 ICSE PDF Download

Introduction
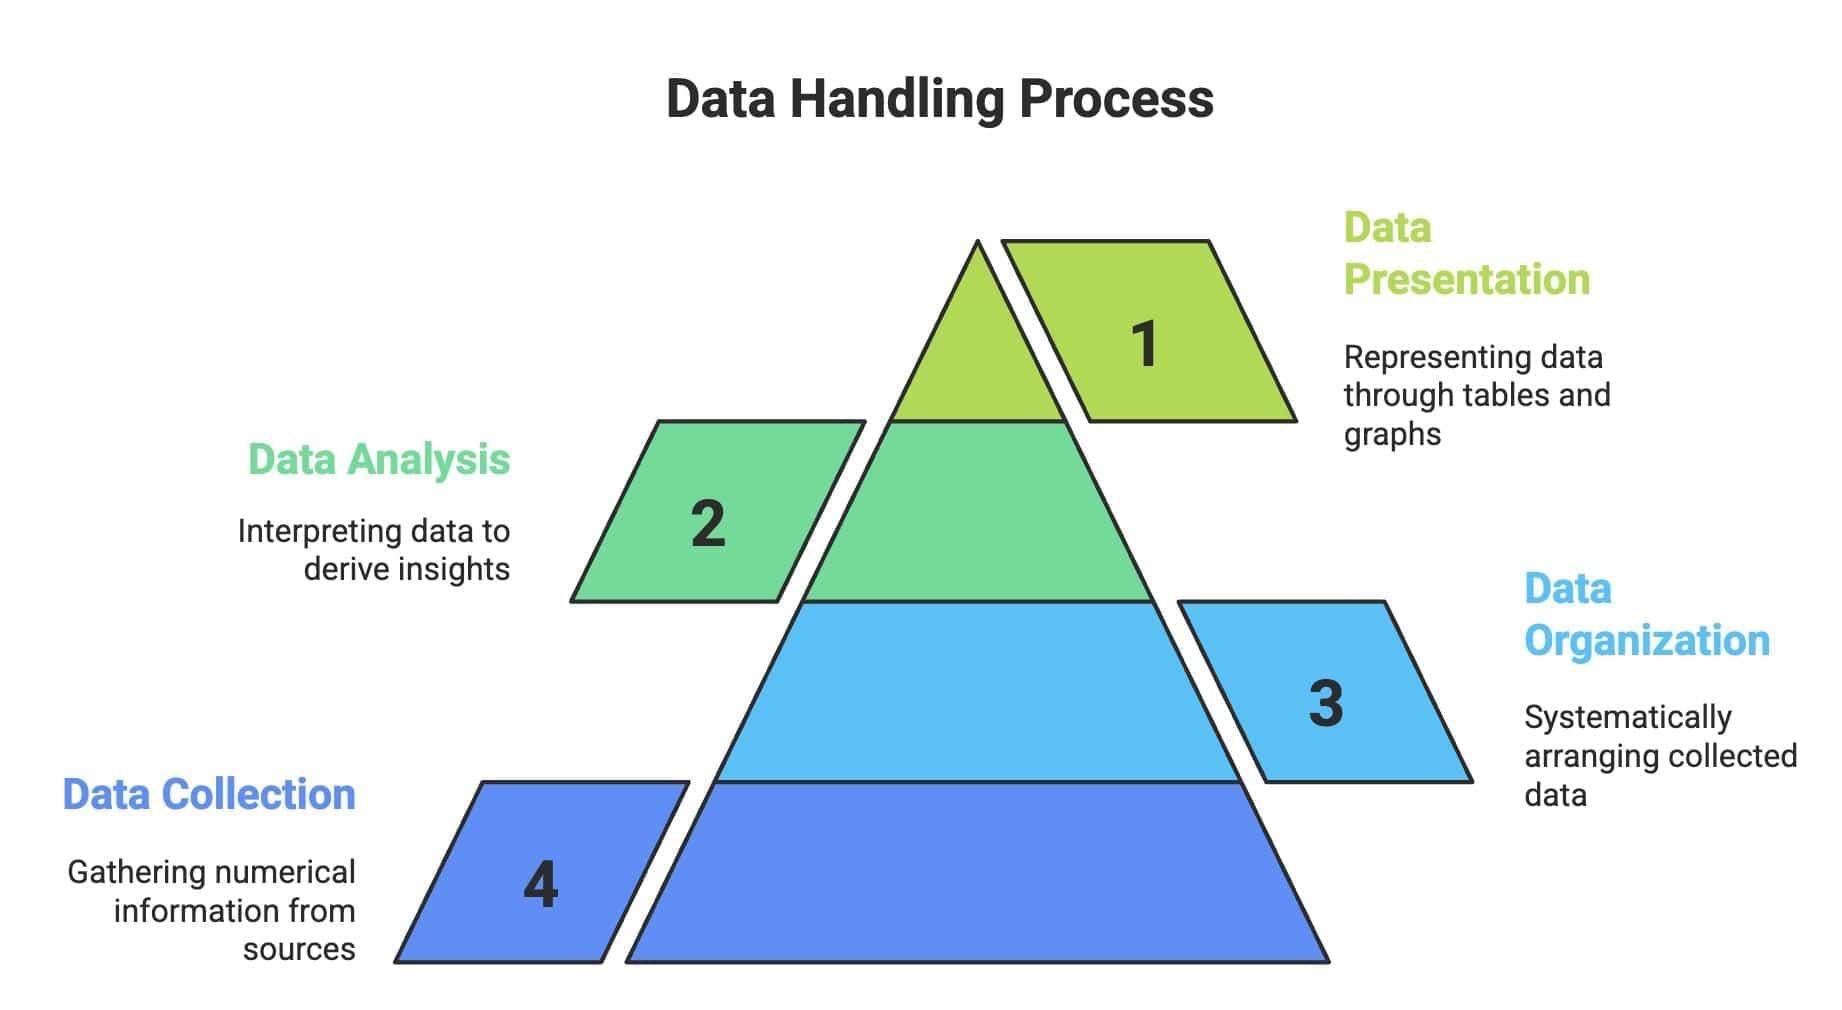
Data Handling is an essential chapter in Class 8 Mathematics that introduces students to the concept of statistics, focusing on how numerical information, or data, is collected, organised, analysed, and presented. This chapter explores the systematic arrangement of data, its representation through tables and graphs, and the interpretation of numerical facts to derive meaningful insights. By learning these concepts, students develop skills to handle real-world data effectively, such as population statistics, exam results, or weather records, making it easier to understand trends and patterns.
Key Points
Statistics has two meanings:
- Singular: Refers to the subject of statistics, which involves collecting, analysing, presenting, and interpreting numerical data.
- Plural: Refers to a collection of numerical data gathered systematically for a specific purpose. This includes data on population, taxes, or the number of students failing in a school.
Data
- Data is a set of numerical facts collected for a specific purpose.
- Data can be gathered by individuals (e.g., asking people about their income or age) or from government sources (e.g., birth rates or price changes over time).
- Once collected, data must be organised systematically, usually in a table, to understand its key points.
- The process of arranging data in a table is called tabulation.
Frequency
- Frequency is the number of times a specific value appears in a data set.
- It helps to count how often each data point occurs.
- Steps to find frequency:
- Identify each unique value in the dataset.
- Count how many times each value appears.
- Record the count as the frequency of that value.
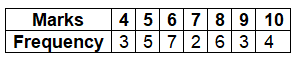
- Frequency of 5 is 4 (appears four times).
- Frequency of 3 is 2 (appears twice).
- Frequency of 7 is 3 (appears three times).
- Frequency of 8 is 2 (appears twice).
Raw Data, Arrayed Data, and Frequency Distribution
- Raw Data: This is the data in its original form, without any modifications or structure, as it is collected.
- Arrayed Data: Data arranged in ascending or descending order of magnitude.
- Frequency Distribution: A table showing each unique value in the data and its frequency.
- Steps to create arrayed data:
- Begin with the raw data.
- Sort the data in either ascending or descending order.
- Record the sorted data.
- Steps to create a frequency distribution table:
- List all unique values from the data in ascending order.
- Count the frequency of each value.
- Present the values and their frequencies in a table.
- Arrayed Data (ascending): 4, 4, 4, 5, 5, 5, 5, 6, 6, 6, 6, 6, 6, 6, 7, 7, 8, 8, 8, 8, 8, 9, 9, 9, 10, 10, 10, 10.
- Frequency Distribution Table:
Constructing a Frequency Table
- A frequency table organises data by listing unique values and their frequencies.
- Steps to construct a frequency table:
- List all unique values in ascending or descending order in the first column.
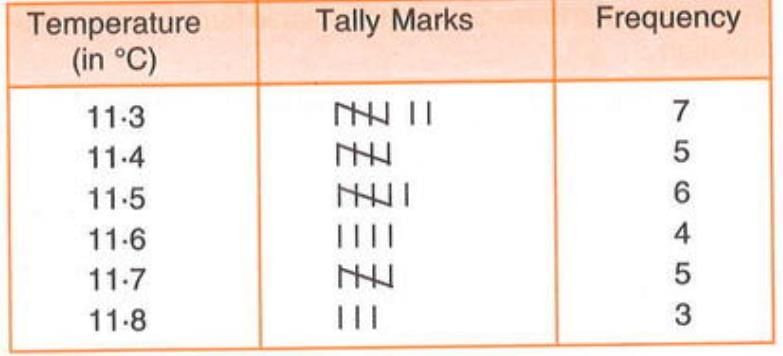
- Use tally marks to count occurrences of each value.
- Record tally marks as short vertical lines; group every five tallies with a diagonal line (e.g., ||||).
- Count the tallies for each value and write the total in the frequency column.
Frequency Table:
Grouped Frequency Distribution
- Grouped frequency distribution is used when data has a wide range of values.
- Data is grouped into class intervals (ranges) to make it easier to organise and analyse.
- Each class interval includes a range of values, and the frequency shows how many data points fall within that range.
- Steps to create a grouped frequency distribution table:
- Determine the class intervals (e.g., 10-20, 20-30, etc.) based on the range of data.
- List the class intervals in the first column.
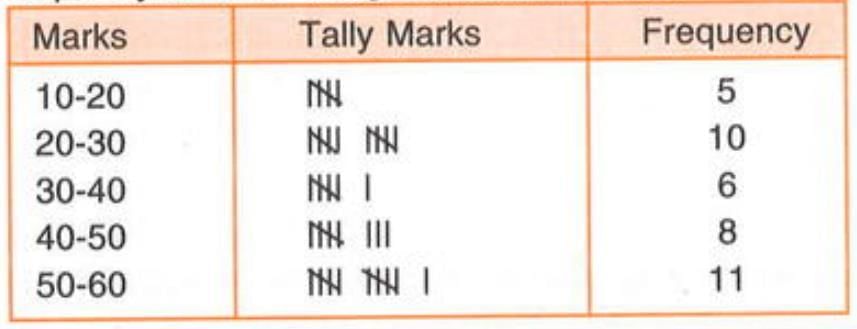
- Use tally marks to count how many values fall within each interval.
- Record the frequency for each interval by counting the tallies.
Note: The upper limit of a class interval is included in the next interval, not the current one (e.g., 20 belongs to 20-30, not 10-20).
Class intervals: 10-20, 20-30, 30-40, 40-50, 50-60.
Grouped Frequency Table:
Class-Intervals and Class-Limits
- A class interval is a range of values used in a grouped frequency distribution (e.g., 10-20, 20-30).
- Each class interval is defined by two numbers called class limits:
- Lower Class Limit: The smaller number in the interval (e.g., 10 in 10-20).
- Upper Class Limit: The larger number in the interval (e.g., 20 in 10-20).
- The upper limit of one interval becomes the lower limit of the next interval (e.g., 20 in 10-20 and 20-30).
- For the interval 10-20: The lower class limit is 10, and the upper class limit is 20.
- For the interval 20-30: The lower class limit is 20, and the upper class limit is 30.
- The upper limit of the interval 10-20 (which is 20) serves as the lower limit of the next interval, 20-30.
Class Mark
- The class mark is the midpoint of a class interval, representing the average of the lower and upper class limits.
- It gives the central value of the interval.
- Formula for class mark: Class Mark = (Lower Class Limit + Upper Class Limit) ÷ 2.
- Steps to find the class mark:
- Identify the lower and upper class limits of the interval.
- Add the lower and upper limits together.
- Divide the sum by 2 to get the class mark.
- For 10-20: Class Mark = (10 + 20) ÷ 2 = 15.
- For 55-60: Class Mark = (55 + 60) ÷ 2 = 57.5.
Graphical Representation
- Graphical representations make data easier to understand compared to written statements.
- Graphs should have clear titles and labels to convey information effectively.
- Types of graphical representations discussed:
- Bar graph (or Bar chart)
- Pie graph (or Pie chart)
- Histogram
1. Bar Graph (Bar Chart)
- A bar graph uses rectangular bars of equal width to represent numerical data.
- The height of each bar corresponds to the value of the data.
- Steps to draw a bar graph:
- Mark categories (e.g., objects) on the X-axis.
- Mark values (e.g., speed) on the Y-axis.
- Draw bars of equal width for each category.
- Ensure equal spacing between consecutive bars.
- Draw a bar graph with objects on the X-axis and speed on the Y-axis.
- Each bar has the same width, with equal gaps between them.
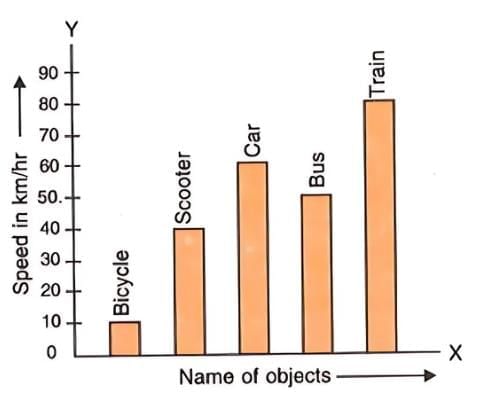
- Bars are drawn to heights corresponding to 10, 40, 60, 50, and 80 km/hr.
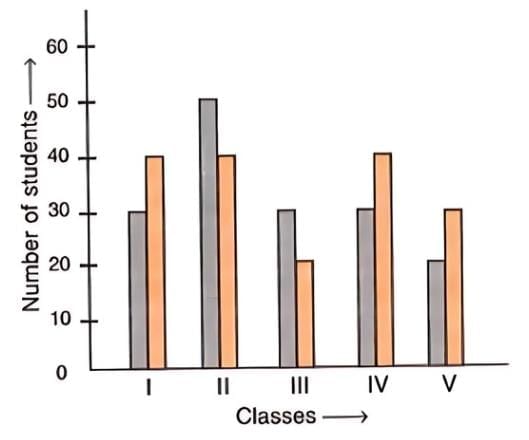
2. Double Bar Graph
- A double bar graph shows two sets of data side by side for comparison.
- Each category has two bars, one for each data set.
Steps to draw a double bar graph:
- Label the X-axis: Write the categories you are comparing along the horizontal axis (X-axis).
- Label the Y-axis: Indicate the values or frequency on the vertical axis (Y-axis).
- Draw the Bars: For each category, draw two bars next to each other. Use different colours or patterns for each bar to distinguish between the two data sets.
- Ensure Consistency: Keep the width and spacing of the bars consistent throughout the graph for better clarity.
3. Pie Graph (or Pie Chart)
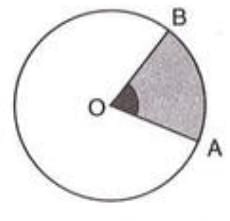
- A pie graph represents data as sectors of a circle, where each sector’s size reflects the data’s proportion.
- The total angle of the circle is 360°, divided according to the data proportions.
- Steps to draw a pie graph:
- Calculate the total sum of the data values.
- Find the central angle for each category: (Value / Total) × 360°.
- Draw a circle of any radius.
- Draw sectors for each central angle.
- Total sum = 10 + 40 + 60 + 50 + 80 = 240.
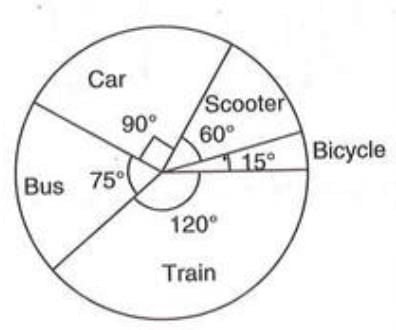
- Bicycle: (10/240) × 360° = 15°
- Scooter: (40/240) × 360° = 60°
- Car: (60/240) × 360° = 90°
- Bus: (50/240) × 360° = 75°
- Train: (80/240) × 360° = 120°
Drawing the Pie Graph: Use the calculated angles to create sections in the circl
4. Histogram
- A histogram represents grouped frequency distributions using bars.
- Bars are drawn with class intervals as bases on the X-axis and frequencies as heights on the Y-axis.
- Unlike bar graphs, histograms have no gaps between bars as class intervals are continuous.
- Steps to draw a histogram:
- Mark class intervals on the X-axis.
- Mark frequencies on the Y-axis.
- Draw bars with class intervals as bases and heights proportional to frequencies.
- If the first class interval does not start at 0, use a zig-zag line to indicate the scale starts at a non-zero value.
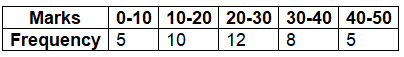
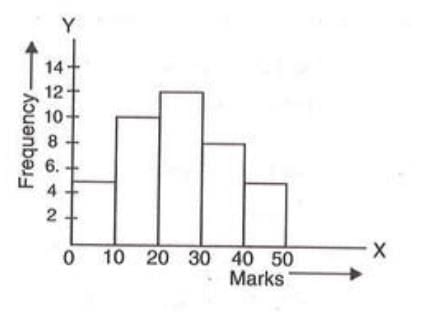
- Draw a histogram with class intervals (0-10, 10-20, etc.) on the X-axis and frequencies on the Y-axis.
- Draw bars with no gaps, heights corresponding to 5, 10, 12, 8, and 5.
|
23 videos|98 docs|14 tests
|
FAQs on Data Handling Chapter Notes - Mathematics Class 8 ICSE
| 1. What is the difference between raw data and arrayed data? |  |
| 2. How do you construct a frequency table? | |
| 3. What is a grouped frequency distribution, and when is it used? | |
| 4. What are class-intervals and class-limits in frequency distribution? | |
| 5. How is a class mark calculated, and why is it important? | |


Viva Questions
,video lectures
,practice quizzes
,Data Handling Chapter Notes | Mathematics Class 8 ICSE
,Sample Paper
,study material
,Summary
,Extra Questions
,mock tests for examination
,Data Handling Chapter Notes | Mathematics Class 8 ICSE
,Free
,Exam
,past year papers
,Previous Year Questions with Solutions
,MCQs
,ppt
,Semester Notes
,Data Handling Chapter Notes | Mathematics Class 8 ICSE
,Important questions
,shortcuts and tricks
,Objective type Questions
;


Chapter Notes: Data Handling Free PDF Download
Importance of Chapter Notes: Data Handling
Chapter Notes: Data Handling
Chapter Notes: Data Handling Class 8 Questions
Study Chapter Notes: Data Handling on the App
|
© EduRev
|
Education Revolution
|


|


