Overview: Probability, Random Variables, and Probability Distributions Chapter Notes | AP Statistics - Grade 9 PDF Download

Probabilistic reasoning allows statisticians to quantify the likelihood of random events over the long run and to make statistical inferences. Simulations and concrete examples can help students to understand the abstract definitions and calculations of probability. This unit builds on understandings of simulated or empirical data distributions and fundamental principles of probability to represent, interpret, and calculate parameters for theoretical probability distributions for discrete random variables. Interpretations of probabilities and parameters associated with a probability distribution should use appropriate units and relate to the context of the situation.
As highlighted by the College Board's blurb of Unit 4, probabilistic reasoning is an important aspect of statistical analysis, as it allows statisticians to make predictions about the likelihood of certain events occurring based on data and probability theory. Simulations and concrete examples can be useful for helping students to understand and apply the abstract concepts of probability and probability distributions.
In this unit, students learn about theoretical probability distributions, which are used to describe the possible values and likelihoods of a random variable. These distributions can be either discrete or continuous, and they are characterized by specific parameters that describe the shape and behavior of the distribution.
It's important for you and me to understand the context and units of the probabilities and parameters associated with a probability distribution, as this can help them to interpret and apply their analyses to real-world situations!
Probability: What are the Odds?
Have you ever wondered how meteorologists determine their forecasts? What about the likelihood of a sports team winning a game? Analysts like meteorologists or sports analysts use probability models based on similar conditions in the past to predict the likelihood of these things happening in the present! In this unit, you will learn some basics of probability and get a taste of what these statisticians use every day to keep us safe and sound.
Probability is the study of possible outcomes and determining the chance of something happening. It is an essential part of statistics since we use probability as one of the main factors in making predictions or testing claims, which is what statistics is all about.
Categorical Variables
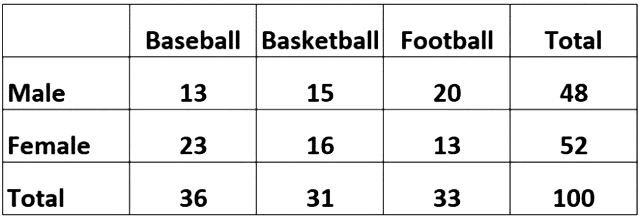
The most common type of probability you will encounter in this unit will deal with categorical variables. Recall from Unit 1 and Unit 2 that categorical variables are often represented with frequency tables or two-way tables. There are some important rules for determining probabilities from these types of displays that are essential to know in order to be successful on the AP exam.
Quantitative Variables
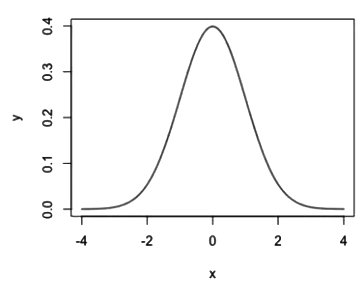
The other type of variable that you will encounter is quantitative variables. Quantitative variables will generally be dealt with using density curves, most notably the normal distribution. The normal distribution is the most useful tool in statistics and hinges on a good understanding of probability.
Probability Rules
There are many important rules and conditions that come into play when determining the probability of certain events happening. In order to be successful on the AP Exam, it is important to familiarize yourself with these rules and conditions.
Independence
The most important probability condition that you need to be aware of is the concept of independence. This will also be essential as we progress to inferential statistics in Units 6-9.
In order to determine whether two events are independent, it's important to consider whether the outcome of one event could potentially affect the outcome of the other. If the outcome of one event has no effect on the outcome of the other, then the events are independent. On the other hand, if the outcome of one event could potentially affect the outcome of the other, then the events are dependent.
- Independent: In the case of flipping two coins, the outcome of one coin flip has no effect on the outcome of the other, so these events are independent.
- Dependent: If we consider the probability of it raining on a given day, this probability may be affected by the temperature and other weather conditions.
Mutually Exclusive
Another key concept in probability is when two events are mutually exclusive. Mutually exclusive events are events that cannot occur simultaneously. In other words, if one event occurs, it is not possible for the other event to occur at the same time.
- An example of mutually exclusive events is the outcome of rolling a single die. If the die is rolled, the outcome can only be one of the six possible numbers.
- Another example: the likelihood of having a hot day and snowing is impossible. Therefore, those two events are mutually exclusive!
Probability Distributions
There are three types of probability distributions we will mainly focus on in this unit: normal distributions, binomial distributions, and geometric distributions. All of these have handy calculator functions that will make our work much easier!
Normal Distribution
The most popular type of distribution in all data situations is the normal distribution. Whether it be ACT scores, heights of people, or blood pressure levels, these all follow normal distributions and make it much easier to calculate where one data point compares to the rest of our data.
Binomial Distribution
It's time to meet a new character in the ever-growing tale of statistics! The binomial distribution is a probability distribution that is used to model the outcome of a series of independent, binary (two-outcome) events. It is characterized by four conditions:
- Two possible outcomes (binary)
- Independent trials
- Fixed number of trials
- All trials are equally likely of occurring
The binomial distribution is used to determine the probability of a certain number of successes occurring within a fixed number of trials. For example, if you wanted to know the probability of flipping a coin 12 times and getting 10 heads, you could use a binomial distribution to model this.
Geometric Distribution
A geometric distribution is very similar to a binomial distribution, with the only difference being that we do not have a fixed number of trials. A geometric distribution typically involves repeating an action until you get a success. In other words, a geometric distribution models an indefinite number of trials until a success is achieved.
An example of a situation that could be modeled by a geometric distribution is flipping a coin until you get a heads. The geometric distribution would be used to model the number of coin flips needed to achieve a heads.
Key Terms to Review
- Binomial Distribution: A probability distribution that summarizes the likelihood of a given number of successes in a fixed number of independent Bernoulli trials.
- Categorical Variables: Types of data that represent distinct categories or groups, rather than numerical values.
- Density Curves: A graphical representation that shows the distribution of a continuous random variable, indicating the likelihood of different outcomes.
- Discrete Random Variables: Numerical outcomes of random processes that can take on a countable number of distinct values.
- Geometric Distribution: Models the number of trials required for the first success in a series of independent Bernoulli trials.
- Independence: The occurrence or outcome of one event does not affect the occurrence or outcome of another event.
- Mutually Exclusive Events: Events that cannot occur at the same time.
- Normal Distribution: A continuous probability distribution characterized by a symmetric, bell-shaped curve.
- Probabilistic Reasoning: The process of drawing conclusions or making predictions based on probabilities.
- Probability Condition: The specific circumstances under which the probability of an event is assessed.
- Theoretical Probability Distributions: Mathematical functions that provide the probabilities of various outcomes in a random experiment.
|
12 videos|106 docs|12 tests
|
FAQs on Overview: Probability, Random Variables, and Probability Distributions Chapter Notes - AP Statistics - Grade 9
| 1. What is the difference between independent and dependent events in probability? |  |
| 2. What are mutually exclusive events, and can you give an example? | |
| 3. What is a normal distribution, and why is it important in statistics? | |
| 4. How does a binomial distribution differ from a geometric distribution? | |
| 5. What are categorical variables, and how are they represented in probability? | |


Overview: Probability
,Extra Questions
,Viva Questions
,Overview: Probability
,Random Variables
,mock tests for examination
,Exam
,and Probability Distributions Chapter Notes | AP Statistics - Grade 9
,Summary
,practice quizzes
,study material
,video lectures
,Random Variables
,and Probability Distributions Chapter Notes | AP Statistics - Grade 9
,past year papers
,Semester Notes
,Important questions
,Objective type Questions
,Previous Year Questions with Solutions
,Free
,shortcuts and tricks
,Random Variables
,and Probability Distributions Chapter Notes | AP Statistics - Grade 9
,Sample Paper
,MCQs
,ppt
,Overview: Probability
;


Chapter Notes: Overview: Probability, Random Variables, and Probability Distributions Free PDF Download
Importance of Chapter Notes: Overview: Probability, Random Variables, and Probability Distributions
Chapter Notes: Overview: Probability, Random Variables, and Probability Distributions
Chapter Notes: Overview: Probability, Random Variables, and Probability Distributions Grade 9 Questions
Study Chapter Notes: Overview: Probability, Random Variables, and Probability Distributions on the App
|
© EduRev
|
Education Revolution
|


|


