Unit 1: National Income Accounting Chapter Notes | Business Economics for CA Foundation PDF Download
Chapter Overview
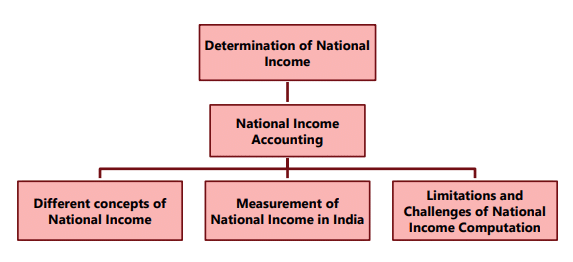
National Income Accounting
National Income Accounting, developed by Nobel Prize-winning economists Simon Kuznets and Richard Stone, is a system of macroeconomic accounts that tracks the journey of goods and services from production to their final disposal.
Understanding National Income Accounts
- Definition and Purpose: National income accounts define specific concepts and then create measures to reflect these concepts. They help us understand the interrelation of various transactions in the economy and provide insights into how the economy functions.
- Importance: These accounts are essential for meeting the needs of the government, private analysts, policymakers, and decision-makers.
Role of the Central Statistical Organisation (CSO)
- The CSO, part of the Ministry of Statistics and Programme Implementation (MoSP&I), is responsible for compiling national accounts statistics.
State-Level Compilation
- At the state level, State Directorates of Economics and Statistics (DESs) are responsible for compiling their State Domestic Product and other aggregates.
Usefulness and Significance of National Income Estimates
National income estimates are like a detailed report card for a country's economy. They show how much money is being made, where it's coming from, and how it's changing over time. This information is super important for understanding how well the economy is doing and for making plans to help it do even better. Here are some key points about why national income estimates are useful:
- For Businesses: Companies use national income data to predict how much people will want to buy in the future. This helps them decide what products to make and how much to produce.
- For Government Planning: The government looks at how much money different sectors (like farming, manufacturing, and services) are making to figure out where to focus its efforts for economic growth. If one sector is doing really well, the government might want to invest more there.
- For Policy Making: National income statistics help in creating models to understand the economy better. They provide a basis for assessing and choosing economic policies. For example, if the data shows that a certain policy is not working, it can be changed based on these insights.
- For Evaluating Government Policies: These estimates are used to evaluate how effective the government’s economic policies are. If the national income is growing, it might mean that the policies are working well.
- For Understanding Income Distribution: National income estimates also give insights into how income is distributed among people in the country. This is important for understanding inequality and making policies to address it.
- For International Comparisons: Comparing national income data with other countries helps in understanding living standards and income levels. This can influence decisions about loans and financial aid from other countries or international organizations.
- For Guiding Financial Policies: When combined with financial and monetary data, national income information helps in making policies related to growth and inflation. For example, if the income is growing but inflation is also rising, the government might need to adjust its policies to keep things balanced.
Various Concepts of National Income
Gross Domestic Product (GDP)
- Nominal GDP or GDP at Market Prices (GDPMP)
- Real GDP
- GDP Deflator
Nominal GDP or GDP at Market Prices
- Gross Domestic Product (GDP) refers to the total value of all final goods and services produced within a country during a specific period. This includes both the value of goods, such as houses and mobile phones, and the value of services, such as telecommunications, healthcare, and insurance. The output of each of these is assessed at its market price, and these values are aggregated to calculate GDP at Market Prices (GDPMP).
- In the first quarter of 2022-23, Nominal GDP or GDP at Current Prices was estimated at ₹ 64.95 lakh crore, compared to ₹ 51.27 lakh crore in the same quarter of 2021-22, indicating a growth of 26.7 percent, although this was lower than the 32.4 percent growth in the first quarter of the previous year.
Real GDP
- Nominal GDP can increase over time due to two factors: the increase in the production of most goods and the rise in prices of these goods. However, to accurately measure production and its changes over time, it is essential to exclude the impact of rising prices from the GDP measure. This is where Real GDP comes into play.
- Real GDP is calculated by summing the quantities of final goods at constant prices, rather than current prices. For instance, in the first quarter of 2022-23, Real GDP or GDP at Constant (2011-12) Prices was estimated to reach ₹ 36.85 lakh crore, up from ₹ 32.46 lakh crore in the same quarter of 2021-22, reflecting a growth of 13.5 percent, compared to 20.1 percent growth in the first quarter of the previous year.
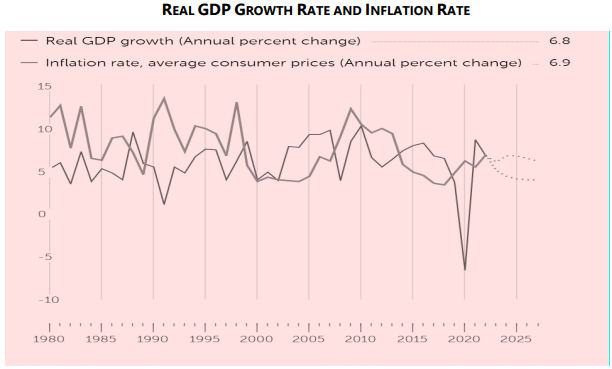
Source IMF Data Mapper Oct 2022 https://www.imf.org/en/Countries/IND
GDP Deflator
- The GDP deflator is a useful measure of inflation derived from the calculation of Real GDP. It is the ratio of Nominal GDP to Real GDP for a given year, expressed as a percentage.
- GDP Deflator = (Nominal GDP / Real GDP) x 100
- The deflator serves to ‘deflate’ or remove the effects of inflation from GDP, acting as a price index that converts Nominal GDP to Real GDP. It measures the current level of prices in relation to the price level in the base year. Since Nominal GDP and Real GDP are identical in the base year, the deflator for that year is always set at 100.
Inflation and GDP Deflator
Inflation is an important aspect of economic performance and plays a key role in guiding economic policy. The GDP deflator is one way to measure inflation between two consecutive years. The formula to calculate the inflation rate using the GDP deflator is:
Inflation rate in year 2 = (GDP deflator in year 2 - GDP deflator in year 1) / GDP deflator in year 1 x 100
GDP Deflator in India
- The GDP deflator in India is expected to reach 154.87 points by the end of 2022.
- In the long term, it is projected to be around 167.94 points in 2023 and 175.67 points in 2024.
Calculating Inflation Rate for 2023
- Using the projected GDP deflator values:
- Inflation Rate in 2023 = (167.94 - 154.87) / 154.87 x 100
- This gives an inflation rate of 8.439 percent for 2023 compared to 2022.
GDP Deflator
Interpretation
- A GDP deflator above 100 indicates that price levels are higher compared to the base year.
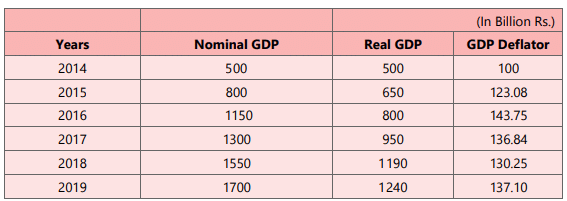
- From 2015 to 2019, price levels were higher than the base year, with 2016 having the highest deflator.
- If the GDP deflator is greater than 100, it means nominal GDP is greater than real GDP.
- If the deflator increases from one year to the next, it indicates rising price levels; if it decreases, prices have fallen.
Numerical Illustrations
ILLUSTRATION 1 :
Find out GDP Deflator? Interpret It
Solution:
A deflator above 100 is an indication of price levels being higher as compared to the base year. From years 2015 through 2019, we find that price levels are higher than that of the base year, the highest being in the year 2016.If the GDP deflator is greater than 100, then nominal
Illustration 2
Given:
- Nominal GDP = ₹ 3000 Crores
- Real GDP = ₹ 4700 Crores
To Find:
- GDP Deflator
- Comment on Price Level
Calculation:
- GDP Deflator = (Nominal GDP / Real GDP) x 100
- = (3000 / 4700) x 100
- = 63.83
Commentary:
- The GDP deflator of 63.83 indicates that the price level in the year being considered is lower than the price level in the base year.
- Since the deflator is less than 100, it suggests a decline in prices relative to the base year.
Illustration 3
Given:
- Real GDP = 450
- Price Index = 120
To Find:
- Nominal GDP
Calculation:
- Nominal GDP = Real GDP x 100 / Price Index
- = 450 x 100 / 120
- = 540
Illustration 4
Given:
- Nominal GNP in 2010 = ₹ 600 Crores
- Price Index in 2010 = 100
- Nominal GDP in 2018 = ₹ 1200 Crores
- Price Index in 2018 = 110
To Find:
- Real GDP in 2018
Calculation:
- Real GDP = (Nominal GDP / Price Index) x 100
- Real GDP in 2018 = (₹ 1200 Crores / 110) x 100
- Real GDP in 2018 = ₹ 1090.91 Crores (approximately)
Net National Product at Market Prices (NNP MP)
- Net National Product at Market Prices (NNP MP) is derived by subtracting depreciation from Gross National Product at Market Prices (GNPMP).
- NNPMP = GNPMP – Depreciation
- Depreciation refers to the reduction in value of capital assets over time due to wear and tear, obsolescence, or usage.
Key Points to Remember
- Real GDP is calculated by adjusting Nominal GDP for changes in the price level, using a Price Index.
- Net Domestic Product (NDP) accounts for depreciation, providing a clearer picture of the net output of an economy.
- Gross National Product (GNP) includes the income earned by a nation's residents abroad and excludes the income earned by foreigners within the country.
- Net Factor Income from Abroad (NFIA) is the difference between the income earned by a country's residents abroad and the income earned by foreigners in that country.
- Net National Product at Market Prices (NNPMP) reflects the total value of goods and services produced by a nation's residents, adjusted for depreciation.
Net National Product at Market Prices (NNPMP)
- NNPMP represents the market value of all final goods and services produced by normal residents within a country's domestic territory, including Net Factor Income from Abroad, during an accounting year, excluding depreciation.
- It can be calculated using the formula: NNPMP = GNPMP – Depreciation
Gross Domestic Product at Factor Cost (GDPFC)
- Gross Domestic Product (GDP) at Factor Cost is derived by subtracting net indirect taxes from GDP at market prices.
- It measures the money value of output produced within a country's domestic limits in a year, as received by the factors of production.
- The distinction between market price and factor cost is based on net indirect taxes, which is calculated as Indirect taxes minus Subsidies.
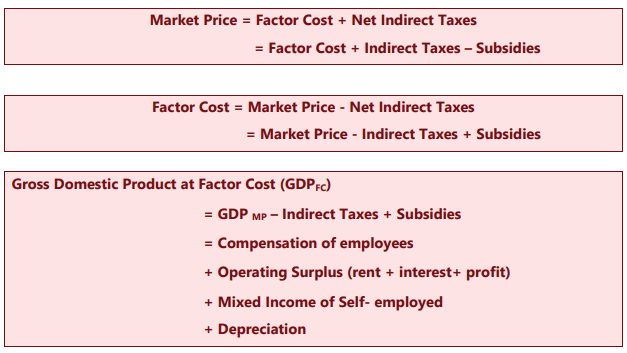
GDP at Factor Cost
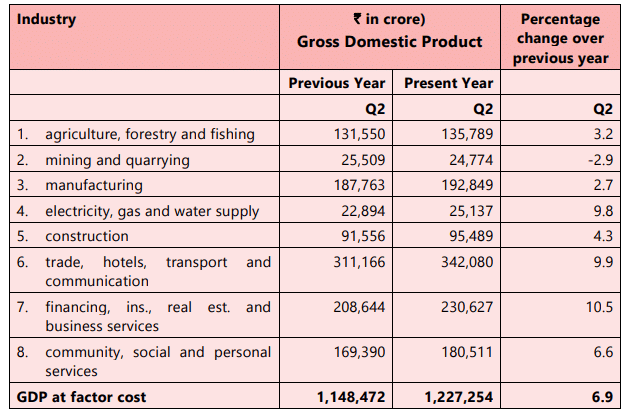
Factor Cost vs Basic Price vs Market Price
GDP at Basic Price
- GDP at Basic Price excludes any taxes on products that the producer receives from the purchaser and passes on to the government, such as GST, Sales Tax, or Services Tax.
- It includes any subsidies the producer receives from the government, which are used to lower the prices charged to purchasers.
- In simple terms, the basic price is the subsidized price without tax.
Basic Price
- Basic Price is calculated as: Basic Price = Factor Cost + Production Taxes - Production Subsidies
- Factor Cost plus production taxes minus production subsidies equals basic prices.
- Basic Price is related to Market Price by: Basic Price + Product Tax - Product Subsidy = Market Price
- Market Price includes both product tax and production tax but excludes both product and production subsidies.
Net Domestic Product at Factor Cost (NDPFC)
- NDPFC represents the total factor incomes earned by the factors of production within a country, net of depreciation.
- NDPFC is calculated by deducting indirect taxes and adding subsidies to the Net Domestic Product at Market Price.

Net National Product at Factor Cost (NNPFC) or National Income
- National Income is the factor income accruing to the normal residents of a country during a year, including domestic factor income and net factor income from abroad.
- NNPFC is calculated as: NNPFC = National Income = Factor Income in Domestic Territory + Net Factor Income from Abroad
- If Net Factor Income from Abroad (NFIA) is positive, national income will be greater than domestic factor incomes.
Per Capita Income
- GDP per capita measures a country's economic output per person by dividing the gross domestic product, adjusted for inflation, by the total population.
- GDP per capita serves as an indicator of the standard of living within a country.
Personal Income
- Personal Income refers to the income received by the household sector, including Non-Profit Institutions Serving Households.
- Personal Income includes current income receipts from all sources, which may or may not be earned from productive activities.
- Examples of sources for Personal Income include transfer payments such as social security benefits, unemployment compensation, and welfare, which are not earned through productive activities.

Disposable Personal Income (DI)
- Disposable Personal Income (DI) represents the amount of money individuals have available for consumption or savings after deducting direct taxes and other compulsory payments to the government from their Personal Income (PI).
- DI is calculated using the formula: DI = PI - Personal Income Taxes - Non-Tax Payments.
- This measure reflects the financial resources individuals can use freely, either for spending on goods and services or for saving.
Net National Disposable Income (NNDI)
- Net National Disposable Income (NNDI) is an economic indicator that measures the total income available to a nation for consumption or saving, after accounting for depreciation of capital.
- It is calculated by adding Net National Income (NNI) to other net current transfers from the rest of the world, which include receipts minus payments.
- An alternative formulation of NNDI includes net taxes on income and wealth receivable from abroad, as well as net social contributions and benefits receivable from abroad.
Gross National Disposable Income (GNDI)
- Gross National Disposable Income (GNDI) is a measure of the total income available to a nation for consumption or saving, before accounting for depreciation of capital.
- It is calculated by adding Net National Disposable Income (NNDI) to Consumption of Fixed Capital (CFC), or by adding Gross National Income (GNI) to other net current transfers from the rest of the world.
- GNDI provides insight into the overall economic resources available to a country, including income generated domestically and income received from abroad.
Concept of Domestic Income
Domestic income refers to the income generated within a country, regardless of whether it is earned by residents or non-residents. It encompasses all economic activities taking place within the domestic boundaries, including production, services, and any other income-generating activities.
The domestic income can be further categorized based on the sectoral distribution of income and the ownership of the income generated.
Income from Domestic Product Accruing to the Public Sector
- This includes income from property and entrepreneurship that accrues to government administrative departments and non-departmental enterprises.
- Government departments generate income through various means such as rent, interest, and profits from public enterprises.
- Non-departmental enterprises, which are also owned by the government but operate independently, contribute to the public sector’s income through their profits.
Income from Domestic Product Accruing to the Private Sector
- This is calculated by deducting the income from property and entrepreneurship accruing to government administrative departments and the savings of non-departmental enterprises from the Net Domestic Product at Factor Cost (NDPFC).
- NDPFC represents the total income generated within the country after deducting depreciation and indirect taxes.
- The formula for calculating income from domestic product accruing to the private sector is as follows:
- Income from Domestic Product Accruing to the Private Sector = NDPFC - Income from Property and Entrepreneurship Accruing to Government Administrative Departments - Savings of Non-Departmental Enterprises
Private Income
Definition: Private income refers to the total income (both factor income and transfer income) that accrues to the private sector from all sources within and outside the country. It includes income generated from domestic production as well as income received from abroad.
Formula: Private Income can be calculated using the following formula:
- Private Income = Factor Income from Net Domestic Product Accruing to the Private Sector + Net Factor Income from Abroad + National Debt Interest + Current Transfers from Government + Other Net Transfers from the Rest of the World
Components of Private Income:
- Factor Income from Net Domestic Product Accruing to the Private Sector: This includes wages, profits, rents, and interest earned by the private sector from the net domestic product.
- Net Factor Income from Abroad: This is the difference between factor income earned by residents from abroad and factor income earned by non-residents from the domestic economy.
- National Debt Interest: Interest payments on the national debt that accrue to the private sector.
- Current Transfers from Government: Transfers from the government to the private sector, such as social security payments and unemployment benefits.
- Other Net Transfers from the Rest of the World: This includes net transfers from the rest of the world to the private sector, such as remittances and gifts.
Illustration 5
Given Data:
- Operating Surplus: 2000 Crores
- Mixed Income of Self-Employed: 1100 Crores
- Rent: 400 Crores
- Net Indirect Tax: -50 Crores
- Consumption of Fixed Capital: 1000 Crores
Solution
Step 1: Calculate GDPMP
- GDPMP = Compensation of Employees + Mixed Income of Self-Employed + Operating Surplus + Depreciation + Net Indirect Taxes
- Operating Surplus = Rent + Profit + Interest
- GDPMP = 1000 + 1100 + (Rent + Operating Surplus) + 400 + (-50)
- GDPMP = 1000 + 1100 + 2000 + 400 + 450 = 4950 Crores
Step 2: Calculate GNPMP
- GNPMP = GDPMP + NFIA
- GNPMP = 4950 + (-50) = 4900 Crores
Step 3: Calculate NNPMP
- NNPMP = GNPMP - Consumption of Fixed Capital
- NNPMP = 4900 - 400 = 4500 Crores
Step 4: Calculate NNPFC or NI
- NNPFC = NNPMP - Net Indirect Taxes
- NNPFC = 4500 - 450 = 4050 Crores
Illustration 6
Given Data:
- Net National Product at Market Price: 1,891 Crores
- Indirect Taxes: 175 Crores
- Subsidies: 30 Crores
- Interest on National Debt: 450 Crores
- Current Transfers from Rest of the World: 100 Crores
- Saving of Non-Departmental Enterprises: 200 Crores
- Saving of Private Corporate Sector: 300 Crores
- Corporate Profit Tax: 100 Crores
Solution
Step 1: Calculate National Income
- National Income = Net National Product at Market Price - Indirect Taxes + Subsidies
- National Income = 1,891 - 175 + 30 = 1,746 Crores
Step 2: Calculate Personal Income
- Personal Income = National Income - Income from Property and Entrepreneurship Accruing to Government Administrative Departments - Saving of Non-Departmental Enterprises + Interest on National Debt + Current Transfers from Government + Current Transfers from Rest of the World - Saving of Private Corporate Sector - Corporate Profit Tax
- Personal Income = 1,746 - 200 - 200 + 450 + 100 + 100 - 300 - 100 = 1,696 Crores
Illustration 7
In a specific year, a country's GDP at market price was ₹ 1,100 Crores. The Net Factor Income from Abroad was ₹ 100 Crores. The value of Indirect taxes minus Subsidies was ₹ 150 Crores, and the National Income was ₹ 850 Crores. Given
- GDPMP = 1100 Crores,
- NFIA = 100 Crores,
- NIT = 150 Crores,
- NNPFC = 850 Crores
Solution
- Step 1: Calculate GDP at factor cost
- GDPFC = GDPMP - NIT
- = 1100 - 150
- = 950 Crores
- Step 2: Calculate GNP at factor cost
- GNPFC = GDPFC + NFIA
- = 950 + 100
- = 1050 Crores
- Step 3: Calculate NNP at factor cost
- NNPFC = GNPFC - Depreciation
Step 4: Rearranging the formula
- 850 = 1050 - Depreciation
- Step 5: Calculate Depreciation
- Depreciation = 1050 - 850
- = 200 Crores
Therefore, the aggregate value of depreciation is ₹ 200 Crores.
Illustration 8
Given Information
- NDP at Factor Cost: ₹ 14,900 Crores
- Income from Domestic Product Accruing to Government: ₹ 335 Crores
- Transfer Payments by Government: ₹ 262 Crores
- Net Private Donation from Abroad: ₹ 222 Crores
- Direct Taxes: ₹ 222 Crores
- Taxes on Corporate Profits: ₹ 222 Crores
- Undistributed Profits of Corporations: ₹ 222 Crores
Calculation of NNP at Market Price
- NNP at Market Price = NNP at Factor Cost + Indirect Tax - Subsidies
- NNP at Factor Cost = NDP at Factor Cost + NFIA
- NNP at Factor Cost = ₹ 14,900 Crores + ₹ 80 Crores = ₹ 14,980 Crores
- NNP at Market Price = ₹ 14,980 Crores + ₹ 335 Crores - ₹ 262 Crores = ₹ 15,053 Crores
Calculation of Disposable Personal Income (DI)
- Disposable Personal Income (DI) = Personal Income - Personal Income Tax
- Personal Income (PI) = National Income + Income Received but Not Earned - Income Earned but Not Received
- PI = ₹ 14,980 Crores + ₹ 170 Crores + ₹ 60 Crores + ₹ 30 Crores - ₹ 150 Crores - ₹ 222 Crores - ₹ 105 Crores
- PI = ₹ 14,763 Crores
- DI = ₹ 14,763 Crores - ₹ 100 Crores = ₹ 14,663 Crores
Final Results
- NNP at Market Price: ₹ 15,053 Crores
- Disposable Personal Income: ₹ 14,663 Crores
Measurement of National Income in India
Circular Flow of Income
The circular flow of income refers to the ongoing circulation of production, income generation, and expenditure involving various sectors of the economy. This process consists of three interconnected phases: production, distribution, and disposition.
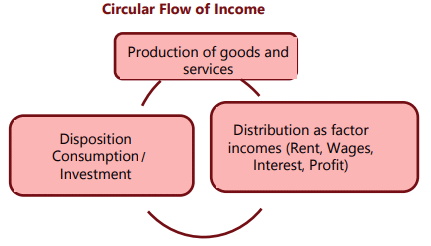 (i) Production Phase: In this phase, firms produce goods and services using factor services such as labor, land, capital, and entrepreneurship.
(ii) Distribution Phase: During this phase, factor incomes in the form of rent, wages, interest, and profits flow from firms to households.
(iii) Disposition Phase: In this phase, the income received by the factors of production is spent on consumption and investment goods, leading to further production and sustaining the circular flow.
Different Angles of National Income
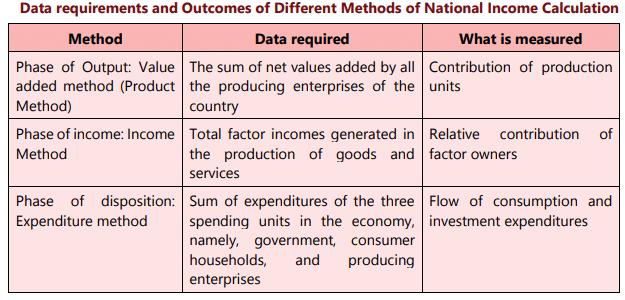
- National income can be viewed from three different angles: (a) Flow of Production or Value Added (b) Flow of Income (c) Flow of Expenditure
- Each angle suggests a different method of calculation and requires specific data.
Three Methods of Measuring National Income
- Value Added Method: Also known as the Product Method, this measures the sum of net values added by all producing enterprises in the country.
- Income Method: This method calculates the total factor incomes generated in the production of goods and services.
- Expenditure Method: This method sums the expenditures of three spending units in the economy: government, consumer households, and producing enterprises.
Value Added Method or Product Method
The value added method calculates national income by summing up the net value added at factor cost from all producing units in the economy. This method measures the contribution of each producing enterprise within the country's domestic territory over an accounting year, taking into account the production of each industry minus intermediate purchases from other industries. It reflects the unduplicated contribution of each industry to the total output. The process involves several steps:
Step 1: Identify and Classify Producing Enterprises
Producing enterprises are classified into three main sectors:
- Primary Sector
- Secondary Sector
- Tertiary Sector (Service Sector)
Each sector is further divided into sub-sectors, and each sub-sector is categorized into specific commodity groups or service groups.
Step 2: Estimate Gross Value Added (GVA)
- Gross Value Added at Market Price (GVA MP) is calculated for each producing enterprise using the formula:
GVA MP = Value of Output - Intermediate Consumption
GVA MP = (Sales + Change in Stock) - Intermediate Consumption
- Note: Imports are included in intermediate consumption based on total purchases or domestic purchases. Sales include exports unless specified otherwise.
Step 3: Estimate National Income
a. Calculate Net Value Added (NVA MP) for each unit:
NVA MP = GVA MP - Depreciation
b. Aggregate NVA MP for all units to obtain Net Domestic Product (NDP):
NDP = ∑ NVA MP
c. Calculate National Income:
National Income = NDP - Net Indirect Taxes + Net Factor Income from Abroad
d. Include additional items:
- Own account production of fixed assets by government, enterprises, and households.
- Imputed value of production of goods for self-consumption.
- Imputed rent of owner-occupied houses.
Change in Stock (Inventory)
- Production and Factor Incomes: Production involves the combined efforts of all factors of production, each of which is compensated for its services. The output generated by a producing unit is distributed among these factors as payment for their contributions.
- Factor Income Method: Also known as the Factor Payment Method or Distributed Share Method, this approach calculates national income by summing up the factor incomes paid out by all production units within a country's domestic territory. This includes wages and salaries, rent, interest, and profit. Factor payments to both residents and non-residents are included.
- Net Domestic Product at Factor Cost (NDPFC): This represents the sum of factor incomes paid out by all production units within a country's domestic territory.
- Net National Product at Factor Cost (NNPFC) or National Income: This is equivalent to the compensation of employees. Only incomes earned by the owners of primary factors of production are included in national income. For instance, while wages of laborers are included, pensions of retired workers are excluded.
- Compensation of Employees: This comprises wages and salaries, along with bonuses, dearness allowances, commissions, employers’ contributions to provident funds, and the imputed value of compensation in kind.
- Non-Labor Income: This includes actual and imputed rent, royalties, interest on loans for productive services, dividends, undistributed profits of corporations before taxes, and profits of unincorporated enterprises and government enterprises.
- Exclusions: Interest paid by the government on public debt, interest on consumption loans, and interest paid by one firm to another are excluded from national income.
- Profit Calculation: Profit is calculated as corporate taxes plus retained dividends and earnings.
- Inclusions and Exclusions: When using the income method, capital gains, windfall profits, transfer incomes, income from the sale of second-hand goods and financial assets, and payments out of past savings are not included. However, commissions, brokerages, and the imputed value of services provided by owners of production units are included as they contribute to the current flow of goods and services.
- Mixed Income: In cases where it is difficult to separate labor income from capital income, such as with self-employed individuals like lawyers, engineers, traders, and proprietors, a category called “mixed income” is introduced. This category includes incomes that are challenging to differentiate, especially in sectors like agriculture, trade, and transport in underdeveloped countries, including India.
Expenditure Approach to National Income Accounting
The expenditure approach, also known as the Income Disposal Approach, measures national income as the total final expenditure in an economy during a specific accounting year. In this approach, Gross Domestic Product at Market Prices (GDPMP) is calculated by summing up all final expenditures.
GDPMP = ∑ Final Expenditure
This method focuses on the demand side of goods and services, considering the purchases made by different types of final users. The key components of final expenditure include:
1. Final Consumption Expenditure
(a) Private Final Consumption Expenditure (PFCE)
- PFCE measures the final sales of goods and services to consumer households and non-profit institutions for consumption, excluding items meant for production.
- It includes the value of primary products produced for own consumption by households, payments for domestic services rendered between households, and net foreign investment.
- However, land and residential buildings purchased or constructed by households are not included in PFCE; they fall under gross capital formation.
- Only expenditure on final goods and services produced during the measurement period and net foreign investment are considered in this method.
(b) Government Final Consumption Expenditure
- Government Final Consumption Expenditure is based on the total expenditure by the government on collective services such as defense, education, and healthcare, as these services are not sold in the market.
- Since these services are not sold, their value is determined by the money spent by the government on their production.
- However, transfer payments like pensions, scholarships, and unemployment allowances are excluded from this expenditure as they do not reflect consumption.
2. Gross Domestic Capital Formation
- Gross Domestic Capital Formation, also known as Gross Investment, refers to the portion of a country's total expenditure that is not consumed but added to the nation's fixed tangible assets and stocks.
- This includes the acquisition of fixed assets and the accumulation of stocks, such as raw materials, fuels, finished goods, and semi-finished goods.
- Gross Investment encompasses final expenditure on machinery and equipment, own account production of machinery and equipment, construction expenditures, changes in inventories, and the acquisition of valuables like jewelry and works of art.
3. Net Exports
- Net exports represent the balance between a country’s exports and imports within a specific accounting year. This figure can be either positive or negative, depending on whether a country exports more than it imports or vice versa.
National Income Calculation using the Expenditure Method
GDP at Market Price (GDPMP) = C + GDFC + NX
- Where: C. Private Consumption Expenditure GDFC. Gross Fixed Capital Formation NX. Net Exports (Exports - Imports)
- Gross National Product at Market Price (GNPMP)= GDPMP + Net Factor Income from Abroad (NFIA)
- Gross National Product at Factor Cost (GNPFC)= GNPMP - Net Indirect Taxes (NIT)
- Net National Product at Factor Cost (NNPFC)= GNPFC - Depreciation
Importance of Different Methods:
- Ideally, all three methods of computing national income should yield the same figure. However, measuring national income through different methods provides a multi-dimensional view of the economy.
- Each method has its own measurement errors, and using all three methods helps in cross-checking and improving the accuracy of the national income figure.
- Different methods also offer unique insights into the economic structure, making it easier to understand various aspects of the economy.
Application of Methods in Different Sectors:
- The income method is often more suitable for developed economies where income tax returns are filed accurately.
- With advancements in estimating expenditures, a growing share of national income is being calculated using the expenditure method.
- Countries like India use a combination of methods for different sectors:
- Agricultural Sector: Estimated using the production method.
- Small Scale Sector: Estimated using the income method.
- Construction Sector: Estimated using the expenditure method.
Illustration 9
Calculate National Income by Value Added Method with the help of following data-
Particulars
(in Crores)
Opening stock
Intermediate Consumption
Closing Stock
Excise Tax
NVA(FC)
= GDP (MP) –Depreciation +NFIA- Net Indirect Tax
Where GVA(MP)
= Value of output- intermediate consumption
Value of Output
= Sales+ change in stock
= 700+ (400-500)=600
= 600 – 350= 250
Therefore NI
= 250-150 +30-(110-50)
= 70 Crores
Illustration 10
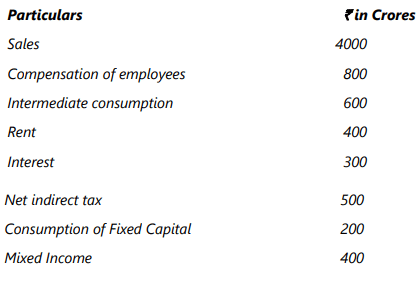
Calculate the Operating Surplus with the help of following data-
Gross Value Added at Market Price (GVAMP)
= Gross Value Output at Market Price – Intermediate Consumption
= 4000 - 600 = 3400
NDPMP = GDPMP – consumption of fixed capital
= 3400 – 200
= 3200 Crores
NDP FC = NDPMP – NIT
= 3200 – 500 = 2700 Crores
NDPFC = Compensation of employees + Operating surplus + Mixed income
2700 = 800 + Operating Surplus + 400
Operating surplus = 1500 Crores
Illustration 11
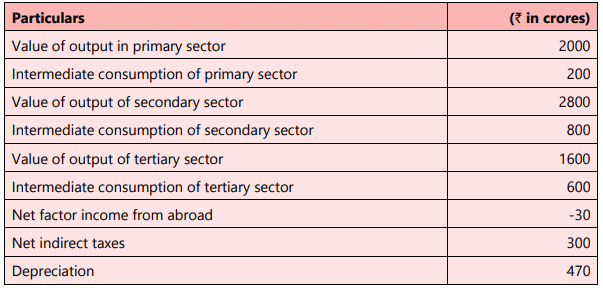
To calculate the national income by the value-added method, we need to consider the value of output and intermediate consumption for each sector:
1. Primary Sector:
- Value of Output:₹ 2800 Crores
- Intermediate Consumption: ₹ 200 Crores
- Value Added: ₹2000 Crores
2. Secondary Sector:
- Value of Output: ₹ 2800 Crores
- Intermediate Consumption: ₹ 800 Crores
- Value Added: ₹ 2000 Crores
3. Tertiary Sector:
- Value of Output: ₹1600 Crores
- Intermediate Consumption: ₹ 600 Crores
- Value Added: ₹ 1000 Crores
Value of output in primary sector = 2000
- Intermediate consumption of primary sector = 200
+ Value of output in secondary sector = 2800
- Intermediate consumption in secondary sector = 800
+ Value of output in tertiary sector = 1600
- Intermediate consumption of tertiary sector = 600
GDP MP = ₹ 4800 CroresNNPFC = GDPMP + NFIA -NIT - Depreciation
NNPFC =National income= 4800 + (-30) - 300 - 470 = 4000 Crores
Calculation of GDP at Market Price (GDP MP):
GDP MP = (Value of Output in Primary Sector - Intermediate Consumption in Primary Sector) + (Value of Output in Secondary Sector - Intermediate Consumption in Secondary Sector) + (Value of Output in Tertiary Sector - Intermediate Consumption in Tertiary Sector)
Calculation of National Net Product at Factor Cost (NNP FC) and National Income:
- NNP FC = GDP MP + Net Factor Income from Abroad (NFIA) - Net Indirect Taxes (NIT) - Depreciation
- NNP FC = National Income = ₹ 4800 + (-30) - 300 - 470 = ₹ 4000 Crores
Illustration 12
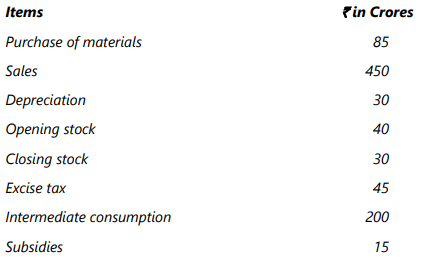
To calculate the Net Value Added by Factor Cost (NVA FC) from the given data, we can follow these steps:
1. Calculate Gross Value Added at Market Price (GVA MP):
GVA MP = Sales + Change in Stock - Intermediate Consumption
= 450 + (30 - 40) - 200
= 240 Crores
2. Calculate Net Value Added at Market Price (NV A MP):
NV A MP = GVA MP - Depreciation
= 240 - 30
= 210 Crores
3. Calculate Net Value Added at Factor Cost (NVA FC):
NVA FC = NV A MP - (Indirect Tax - Subsidies)
= 210 - (45 - 15)
= 180 Crores
Summary:
- Gross Value Added at Market Price = 240 Crores
- Net Value Added at Market Price = 210 Crores
- Net Value Added at Factor Cost = 180 Crores
Illustration 13
To calculate the National Income (NI) using both the Expenditure Method and the Income Method with the provided data:
By Expenditure Method:
NI = Private Final Consumption Expenditure + Government Final Consumption Expenditure + Gross Domestic Capital Formation + Net Exports
Where:
- Gross Domestic Capital Formation = Net Domestic Capital Formation + Depreciation
- Net Exports = Exports - Imports (given as Net Factor Income from Abroad)
By Income Method:
NI = Compensation of Employees + Operating Surplus + Mixed Income + Net Factor Income from Abroad
Where:
- Operating Surplus = Gross Operating Surplus - Taxes + Subsidies
- Mixed Income = Gross Mixed Income - Taxes + Subsidies
You need to plug in the values from the data provided to calculate the National Income using both methods.
By Expenditure method GDPMP = Private final consumption expenditure + Government final consumption expenditure + Gross domestic capital formation (Net domestic capital formation+ depreciation) + Net export
= 2000 + 1100 + (770+ 130) + 30
= 4030Crores
NNPFC or NI = GDPMP - depreciation + NFIA – NIT
= 4030 – 130 + 20 – 120= 3800 CroresBy Income method
NNPFC or NI = compensation of employees+ operating surplus+ Mixed income of self- employed + NFIA
= 1200+ 1820+ 700+ 20= 3740Crores
Understanding the System of Regional Accounts in India
Regional accounts offer a comprehensive database of the numerous transactions occurring within a regional economy, aiding in regional-level decision-making. Currently, nearly all states and union territories in India produce estimates of state income and district-level income.
What is State Income?
- State Income, or Net State Domestic Product (NSDP), measures the total value of all goods and services produced in a state within a specific period, usually a year, without any duplication.
- Per Capita State Income is calculated by dividing the NSDP by the state's mid-year projected population.
How Are State Level Estimates Prepared?
- State level estimates are prepared by the State Income Units within the State Directorates of Economics and Statistics (DESs).
- The Central Statistical Organisation (CSO) supports the states by providing advice on conceptual and methodological issues.
What Are Supra-regional Sectors?
- Supra-regional sectors include activities like railways, communications, banking, insurance, and central government administration that span across state boundaries.
- Since their economic contribution cannot be directly assigned to any one state, estimates for these activities are compiled for the entire economy and then allocated to states based on relevant indicators.
GDP and welfare
GDP is not a perfect measure of a country's welfare because it excludes several important factors that contribute to the overall well-being of citizens. Here are some reasons why GDP may not accurately reflect welfare:
- Income Distribution: GDP per capita does not account for how income is distributed within a country. Two countries with the same per capita income may have vastly different levels of welfare due to unequal income distribution.
- Quality Improvements: GDP does not consider improvements in quality due to technological and managerial innovations, which reflect true growth in output from year to year.
- Hidden Production: Activities that are hidden from government authorities, such as illegal activities (drugs, gambling) or tax evasion, are not included in GDP.
- Nonmarket Production: GDP does not account for nonmarket production and non-economic contributors to well-being, such as health, education, political participation, and other social factors.
- Loss of Leisure Time: GDP increases with more hours of work, but this does not consider the disutility of lost leisure time, which is important for well-being.
- Economic Bads: Negative factors like crime, pollution, and traffic congestion that make people worse off are not deducted from GDP.
- Volunteer Work: GDP does not include the value of volunteer work and services rendered without remuneration, which can contribute to social well-being.
- Externalities: Both positive and negative externalities, which are external effects not captured in market transactions, are not reflected in GDP.
- Defensive Expenditures: Expenditures on police protection and other defensive measures increase GDP but do not indicate an improvement in welfare. For example, increased spending on police due to rising crime rates reflects a worsening situation, not an improvement.
- Automobile Accidents: GDP includes the production of repairs, medical services, insurance, and legal services resulting from automobile accidents, but this does not reflect an improvement in welfare.
In summary, while GDP measures the ability to obtain goods and services, it overlooks crucial aspects that ensure a good quality of life, making it an inadequate measure of welfare.
Limitations and Challenges of National Income Computation
The computation of national income comes with numerous limitations and challenges, making the task more complex in underdeveloped and developing countries. Here are some general dilemmas faced in measuring national income:
Conceptual Difficulties:
- Definition Issues: There is no agreed-upon definition of national income.
- Goods Classification: Distinguishing between final goods and intermediate goods is challenging.
- Transfer Payments: The treatment of transfer payments is problematic.
- Durable Goods Services: Measuring the services provided by durable goods is difficult.
- Income Distribution: Incorporating the distribution of income poses a challenge.
- New Goods Valuation: Valuing a new good at constant prices is complex.
- Government Services Valuation: Valuing government services accurately is challenging.
Data Challenges:
- Data Inadequacy: There is often a lack of reliable data.
- Non-Monetised Sector: The presence of a non-monetised sector complicates data collection.
- Self-Consumption Production: Production for self-consumption is hard to measure.
- Income Recording Issues: Illiteracy and ignorance lead to unrecorded incomes.
- Occupational Classification: Lack of proper occupational classification hampers data collection.
- Consumption of Fixed Capital: Accurately estimating the consumption of fixed capital is challenging.
|
86 videos|255 docs|58 tests
|
FAQs on Unit 1: National Income Accounting Chapter Notes - Business Economics for CA Foundation
| 1. What is national income accounting and why is it important? |  |
| 2. What are the various concepts of national income? |  |
| 3. How is national income measured in India? |  |
| 4. What is the relationship between GDP and welfare? |  |
| 5. What are the limitations and challenges of national income computation? |  |


