Unit 2: Theory of Cost Chapter Notes | Business Economics for CA Foundation PDF Download
| Table of contents |

|
| Cost Concepts |

|
| Cost Function |

|
| Short Run Total Costs |

|
| Long Run Average Cost Curve |

|
| Economies and Diseconomies of Scale |

|
Cost Concepts
(a) Accounting Costs- Accounting costs, also known as explicit costs, refer to the actual cash payments made by an entrepreneur for the factors of production used in the business.
- These costs include wages paid to workers, prices paid for raw materials, fuel and power, rent for buildings, and interest on borrowed money.
- Accounting costs are recorded in the financial statements of the firm and represent expenses already incurred.
(b) Economic Costs
- Economic costs go beyond accounting costs by including implicit costs as well.
- Implicit costs represent the opportunity cost of resources owned by the entrepreneur and used in the business.
- For example, the normal return on capital invested by the entrepreneur, the wages the entrepreneur could have earned by working elsewhere, and the monetary rewards for other factors owned by the entrepreneur are all part of economic costs.
- Economic costs are important for entrepreneurs to cover in order to earn normal profits.
- Normal profit is considered part of implicit costs.
- If total revenue covers both implicit and explicit costs, the entrepreneur has zero economic profits.
- Supernormal profits, or positive economic profits, occur when revenues exceed the sum of explicit and implicit costs.
Implicit Costs - Implicit costs are the costs associated with the opportunity of using resources owned by the entrepreneur in the business.
- These costs are not directly paid out in cash but represent the potential income that could have been earned if the resources were used in an alternative way.
- For example, if the entrepreneur invests his own capital in the business, the interest or dividend that could have been earned by investing that capital elsewhere is an implicit cost.
- Similarly, if the entrepreneur works in his own business instead of selling his services to another employer, the wages he could have earned are implicit costs.
Outlay Costs Versus Opportunity Costs
- Outlay Costs: These costs involve the actual expenditure of funds on various items such as wages, materials, rent, interest, and so on. They represent the tangible financial outlay required for a specific activity or operation.
- Opportunity Costs: Opportunity costs, on the other hand, refer to the cost of the next best alternative opportunity that is foregone in order to pursue a particular action. It signifies the cost of the missed opportunity and entails a comparison between the chosen policy and the rejected one. For instance, the opportunity cost of using capital is the interest that could be earned by utilizing it in the next best alternative with similar risk.
- Nature of Sacrifice: The distinction between outlay costs and opportunity costs lies in the nature of the sacrifice involved. Outlay costs pertain to financial expenditure at a specific point in time and are therefore recorded in the books of accounts. In contrast, opportunity costs represent the amount or subjective value that is forfeited by selecting one activity over the next best alternative. Opportunity costs relate to sacrificed alternatives and are generally not recorded in the books of accounts.
- Practical Utility: The concept of opportunity cost is particularly useful for business managers, especially when resources are scarce and a decision involves choosing one option over others. For example, in a cloth mill that spins its own yarn, the opportunity cost of yarn to the weaving department is the price at which the yarn could be sold. This consideration is crucial for accurately measuring the profitability of weaving operations.
- Long-Term Cost Calculations: Opportunity cost is also relevant in long-term cost calculations. For instance, when evaluating the cost of higher education, factors such as tuition fees and the cost of books are not the only considerations. One must also account for earnings foregone, alternative uses of money paid as tuition fees, and the value of missed activities as part of the cost of attending classes.
Direct or Traceable Costs and Indirect or Non-Traceable Costs
- Direct Costs: Direct costs are those that have a direct relationship with a specific component of the operation, such as manufacturing a product, organizing a process, or conducting an activity. Since these costs are directly associated with a product, process, or machine, they may vary based on changes occurring in these areas. Direct costs are readily identifiable and traceable to a particular product, operation, or plant. Even overhead costs can be considered direct if they pertain to a specific department. Manufacturing costs can be directed to a product line, sales territory, customer class, and so on. It is essential to understand the purpose of cost calculation before determining whether a cost is direct or indirect.
- Indirect Costs: Indirect costs, also known as non-traceable costs, are those that cannot be directly attributed to a specific product, operation, or department. These costs are incurred to support the overall functioning of the organization and are not easily identifiable with a particular cost object. Indirect costs may include general administrative expenses, utilities, and other overhead costs that benefit multiple areas of the organization.
Costs refer to the expenses incurred in the production of goods or services. They play a crucial role in determining the profitability and pricing of products. Different types of costs are categorized based on various factors such as their nature, behavior, and purpose.
Direct and Indirect Costs
- Direct costs are those that can be easily and definitively traced to a specific plant, product, process, or department. These costs are directly attributable to the production of goods or services and include expenses such as raw materials, labour, and manufacturing overhead that can be directly linked to a particular product. For example, the cost of wood used in furniture manufacturing is a direct cost.
- Indirect costs, on the other hand, are not easily identifiable in relation to a specific plant, product, process, or department. These costs are not visibly traceable to specific goods, services, or operations, but are nonetheless charged to different jobs or products in standard accounting practice. Indirect costs may bear some functional relationship to production and can vary with output in some definite way. Examples of indirect costs include electric power, rent, and general administrative expenses that benefit all products jointly.
- Incremental costs are associated with the concept of marginal cost and refer to the additional cost incurred by a firm as a result of a business decision. For instance, if a company decides to change its product line, replace old machinery, or acquire new clients, the costs associated with these decisions are considered incremental costs.
- Sunk costs are costs that have already been incurred and cannot be recovered. These costs are based on past commitments and cannot be revised or reversed. Examples of sunk costs include expenses incurred on advertising, research and development, specialized equipment, and fixed facilities such as railway lines. Sunk costs can act as a barrier to entry for new firms in a business.
- Historical costs refer to the costs incurred in the past for the acquisition of productive assets such as machinery, buildings, and equipment. These costs are based on the price paid for the asset at the time of acquisition. Replacement costs, on the other hand, represent the expenditure required to replace an old asset with a new one. Replacement costs can differ from historical costs due to price fluctuations. For example, if the price of machinery has increased since the time of purchase, the replacement cost will be higher than the historical cost.
- Private costs are costs that are actually incurred or provided for by firms and can be either explicit or implicit. These costs are internalized by the firm and figure in business decisions as part of the total cost. Private costs include expenses such as wages, rent, and raw materials. Social costs, on the other hand, refer to the total cost borne by society as a result of a business activity. Social costs include private costs as well as external costs, which are costs that the firm does not have to pay directly. External costs include the cost of resources such as air, water, and land, which are not priced in the market, as well as the cost of dis-utility created by pollution and environmental degradation. Social costs are important for understanding the true impact of business activities on society and the environment.
Fixed and Variable costs
Fixed Costs
- Fixed costs remain constant regardless of the level of output, up to a certain point. They require a consistent expenditure of funds and do not vary with production levels within a capacity limit. Examples include rent, property taxes, interest on loans, and depreciation (when calculated over time rather than per unit of output).
- However, fixed costs can vary based on the size and capacity of the plant. While they do not change with output volume within a certain capacity, they are influenced by the overall capacity of the facility.
- Fixed costs are unavoidable as long as operations are ongoing. They can only be eliminated when operations are completely shut down. Some fixed costs, like advertising, are discretionary and depend on management's decision to incur them.
- There are also shut-down costs, which continue even after operations are suspended, such as the cost of storing unsold machinery.
Variable Costs
- Variable costs, on the other hand, fluctuate based on the level of output during the production period. Examples include wages for casual labour, raw materials, and other inputs that vary with production levels.
- Variable costs typically increase directly and sometimes proportionately with output. However, there are instances where they may increase less or more than proportionately, depending on how fixed facilities and resources are utilized during production.
Cost Function
A cost function is a mathematical representation that shows how the cost of a product relates to various factors that influence costs. In this function:
- Dependent Variable: This is usually the unit cost or total cost.
- Independent Variables: These can include factors like the price of inputs, the size of the output, technology, capacity utilization, efficiency, and the time period being considered.
The cost function is derived from the production function and the market supply of inputs, illustrating the relationship between costs and output. Cost functions are based on actual cost data from firms and are often depicted through cost curves. The shape of these curves depends on the underlying cost function.
There are two main types of cost functions:
- Short-Run Cost Functions: These apply to situations where some factors are fixed in the short term.
- Long-Run Cost Functions: These apply to scenarios where all factors can be varied in the long run.
Short Run Total Costs
Total, Fixed, and Variable Costs
Variable factors are those that can be easily changed when a company wants to increase its production level. For example:
- The company can hire more workers.
- It can buy more raw materials.
- In contrast, there are fixed factors that cannot be easily adjusted. These include:
- Buildings
- Capital equipment
- Top management team
- Adjusting fixed factors takes a longer time. For instance:
- Installing new machinery requires time.
- Building a new factory also takes time.
- We differentiate between short run and long run based on these factors:
- The short run is a time period where a company can change its output by adjusting only the variable factors.
- In the short run, fixed factors remain constant and cannot be changed.
- If a company wants to increase output in the short run, it can only do so by:
- Hiring more labour
- Purchasing more raw materials
- The long run is a time period where all factors, both variable and fixed, can be adjusted.
- This means that in the long run, all factors become variable.
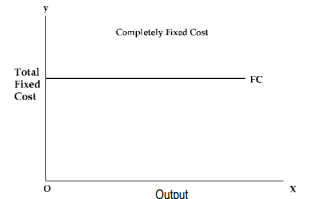
- Fixed costs are costs that do not change with the level of production. They remain constant regardless of how much a company produces. Examples of fixed costs include:
- Contractual rent
- Insurance fees
- Maintenance costs
- Property taxes
- Interest on capital
- Managers’ salaries
- Wages for security personnel
- Even if a company stops production temporarily, it still has to pay these fixed costs.
Variable Factors Fixed Factors Short Run Long Run Fixed Costs Variable Costs
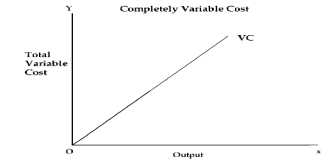
Variable costs are those that change with the level of output, such as wages for temporary labor, prices of raw materials, fuel, power, and transportation costs. If a firm temporarily shuts down, it can avoid incurring variable costs by not using variable factors of production.
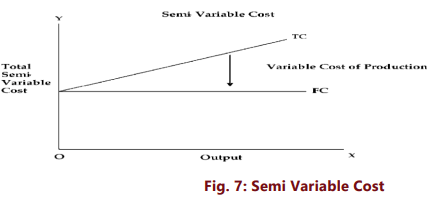
- There are some costs that are not completely variable and not entirely fixed when it comes to how much output changes. These are called semi-variable costs.
- A good example of semi-variable costs can be seen in electricity bills, which typically include:
- A fixed charge that is constant regardless of how much electricity you use.
- A charge that varies based on your consumption of electricity.
- This concept is illustrated clearly in Figure 7.
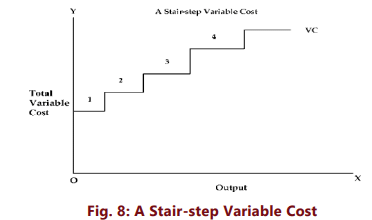
 There are some costs which may increase in a stair-step fashion, i.e., they remain fixed over a certain range of output but suddenly jump to a new higher level when output goes beyond a given limit. E.g. Costs incurred towards the salary of foremen will have a sudden jump if another foreman is appointed when the output crosses a particular limit.
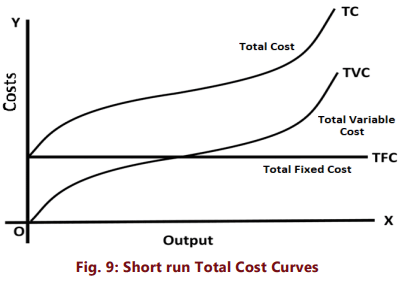
- The total cost of a business refers to the actual expenses needed to produce a specific amount of output.
- The short-run total cost consists of two main parts: total fixed cost (TFC) and total variable cost (TVC).
- This relationship can be expressed as: TC = TFC + TVC.
- We can also illustrate total cost, total variable cost, and total fixed cost using a diagram.
- In the diagram:
- The total fixed cost curve (TFC) is a flat line that runs parallel to the X-axis because TFC doesn’t change regardless of the output level.
- This curve starts at a point on the Y-axis, indicating that fixed costs exist even when there is no output.
- Conversely, the total variable cost curve (TVC) rises as output increases, showing that total variable costs grow with production.
- This curve begins at the origin, meaning variable costs are zero when output is zero.
- Initially, the total variable cost increases at a slower rate, then speeds up as output grows.
- This change in the total variable cost is due to the law of increasing and diminishing returns regarding variable inputs.
- As output rises, more variable inputs are needed to produce the same amount of output because of diminishing returns.
- Therefore, the variable cost curve becomes steeper at higher production levels.
Relationship Between TFC and TVC
- The total cost (TC) curve is obtained by adding the TFC and TVC curves vertically.
- The slopes of the TC and TVC curves are the same at every level of output.
- The vertical distance between the TC and TVC curves at any point represents the total fixed cost.
Impact of Variable Inputs
- The pattern of the TVC curve is influenced by the law of increasing and diminishing returns to variable inputs.
- As output increases, larger quantities of variable inputs are needed to produce the same amount of output due to diminishing returns, causing the TVC curve to become steeper at higher levels of output.
Short Run Average Costs
- Average Fixed Cost (AFC): AFC is calculated by dividing the total fixed cost by the number of units produced (Q). It represents the fixed cost per unit of output. For instance, if a firm has a total fixed cost of ₹2,000 and produces 100 units, the AFC would be ₹20. If the output increases to 200 units, the AFC decreases to ₹10. Since total fixed cost remains constant, AFC decreases as output increases. The AFC curve slopes downward but never touches the X-axis, as AFC can never be zero.
- Average Variable Cost (AVC): AVC is determined by dividing the total variable cost by the number of units produced (Q). It indicates the variable cost per unit of output. AVC typically decreases as output increases from zero to normal capacity due to increasing returns to variable factors. However, beyond normal capacity, AVC rises sharply because of diminishing returns. The AVC curve initially falls, reaches a minimum, and then rises.
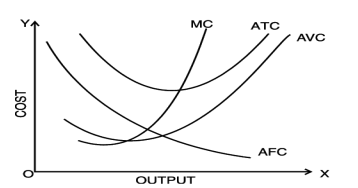
- Average Total Cost (ATC): ATC is the sum of AFC and AVC (ATC = AFC + AVC). It represents the total cost per unit of output. The ATC curve's behavior depends on the AVC and AFC curves. Initially, both AVC and AFC fall, causing the ATC curve to decline sharply. When AVC starts to rise while AFC still falls, ATC continues to decrease. However, as output increases further and AVC rises significantly, ATC starts to increase. The ATC curve is U-shaped, falling initially, reaching a minimum, and then rising.
- Marginal Cost: Marginal cost is the additional cost incurred by producing one more unit of output. It is calculated by the difference in total cost when producing t units instead of t-1 units. For example, if producing 5 units costs ₹200 and producing 6 units costs ₹250, the marginal cost is ₹50. Marginal cost is independent of fixed cost since fixed costs do not change with output. It is influenced by variable costs, which change with the level of output in the short run. Marginal cost can be expressed symbolically as the change in variable costs divided by the change in output.


Marginal cost (MC) initially decreases with increased output, reaching a minimum point before rising again due to the law of variable proportions. This creates a "U" shaped curve. The decline and subsequent rise of the MC curve is influenced by the marginal product, which first increases, then peaks, and finally declines. The MC curve becomes minimum at the point of inflection on the total cost curve.The behaviour of these costs has also been shown in Table 3.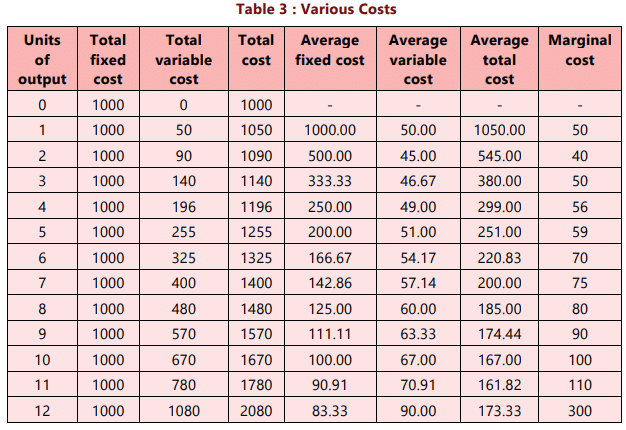
- Fixed costs remain constant even when production increases up to a certain point. As a result, the average fixed cost decreases with each increase in output.
- Variable costs rise, but not always at the same rate as the increase in output. In this case, the average variable cost gradually declines until 4 units are produced, after which it begins to rise.
- Marginal cost refers to the extra cost incurred for producing one more unit. Initially, this cost decreases, but it eventually starts to increase.
Relationship between Average Cost and Marginal Cost
When Average Cost Increases:
- If average cost goes up as output increases, it means that marginal cost is greater than average cost.
When Average Cost is at its Minimum:
- At the point where average cost is at its lowest, marginal cost equals average cost.
- This indicates that the marginal cost curve intersects the average cost curve at its minimum point, which is also known as the optimum point.
Long Run Average Cost Curve
- Definition: The long run average cost curve represents the lowest possible cost of producing a given level of output when all inputs are variable. It shows the relationship between output and long run cost of production.
- Long Run vs. Short Run: In the long run, a firm can adjust all its inputs and choose the most suitable scale of production. This is different from the short run, where some inputs are fixed. For example, in the short run, a firm might be stuck with a specific factory size, but in the long run, it can build a larger or smaller factory based on future production needs.
- Planning Horizon: The long run is a period for planning, during which firms decide on the appropriate scale of production for future output levels. Once a firm establishes a particular scale of production, its operations occur in the short run, even though the planning is for the long run.
- Deriving the Long Run Average Cost Curve: To understand how the long run average cost curve is formed, consider three short run average cost curves, also known as plant curves. These curves represent different possible sizes of plants that a firm can operate in the short run.
- Short Run Average Cost Curves (SACs): These curves indicate the average cost of production for different plant sizes in the short run. For instance, if a firm operates on SAC1, it may produce a certain level of output at a lower cost compared to SAC2 or SAC3.
- Long Run Decision: In the long run, a firm must decide which size of plant to use for optimal production. This decision is based on minimizing total costs for a given level of output. The firm will choose the plant size that offers the lowest unit cost for producing a specific output level.

Example: Suppose a firm is considering producing an output level between OA and OB. If it produces at OA using SAC1, the cost per unit is lower than using SAC2. However, beyond OB, the firm may need to switch to a larger plant represented by SAC3 to maintain cost efficiency.
- As illustrated in Figure 12, the long run average cost (LAC) curve is designed to touch each of the short run average cost (SAC) curves at a single point, known as a tangency point.
- Every point along the LAC curve corresponds to a tangency with a particular SAC curve.
- If a company wants to produce a specific amount of output, it will build a plant that aligns with the related SAC curve for that output.
- For example, to produce output OM, the relevant point on the LAC curve is point G, which is also the tangency point with the SAC2 curve.
- Therefore, to produce OM, the company will use SAC2 and operate at point G.
- Similarly, for different levels of output, the firm will choose the plant that minimizes production costs.
- From the figure, it is evident that larger outputs can be produced at the lowest cost with larger plants, while smaller outputs are most efficiently produced with smaller plants.
- For instance, to produce OM, the company will use SAC2; using SAC3 would lead to higher costs than SAC2.
- On the other hand, a larger output like OV can be produced most cost-effectively with a larger plant represented by SAC3.
- Attempting to produce OV with a smaller plant would result in higher costs per unit due to its limited capacity.
- Additionally, producing larger outputs with smaller plants incurs higher costs because of their restricted capacity.
- It is important to note that the LAC curve does not touch the lowest points of the SAC curves.
- When the LAC curve is decreasing, it touches the declining parts of the SAC curves, and when it is increasing, it touches the rising parts of the SAC curves.
- Thus, to produce output less than OQ at the lowest possible cost, the firm will build a suitable plant and operate it at less than its full capacity, which is below its minimum average cost of production.
- Conversely, for outputs greater than OQ, the firm will construct a plant and operate it above its optimal capacity.
- The output OQ is considered the optimal output because it is produced at the minimum point of both the LAC and the corresponding SAC, specifically SAC4.
- Other plants are either used below their full capacity or beyond it, while only SAC4 is operated at the minimum point.
- The long run average cost curve is often referred to as the planning curve because it guides firms in deciding how to produce any given output in the long run by selecting the appropriate plant on the LAC curve.
- The LAC curve assists firms in determining the ideal plant size for producing a specific output at the lowest possible cost.
Understanding the "U" Shape of the Long Run Average Cost Curve
The LAC curve is "U" shaped, and this shape is related to returns to scale rather than the variable factor ratio that causes the U shape in the short run average cost (SAC) curve. In the long run, all factors are variable, which is why the LAC curve can exhibit this U shape.
Reasons for the U Shape
- Increasing Returns to Scale: When a firm expands its production, it initially experiences increasing returns to scale, where the long run average cost decreases. This is due to internal and external economies of scale, which lower costs as production increases.
- Constant Returns to Scale: After a certain point, the firm may experience constant returns to scale, where the long run average cost remains stable.
- Decreasing Returns to Scale: Eventually, as the firm continues to expand, it may face decreasing returns to scale, leading to an increase in the long run average cost. This occurs due to internal and external diseconomies of scale, where costs rise as production increases.
Impact of Economies and Diseconomies of Scale
- Economies of Scale: The initial decline in the long run average cost is driven by economies of scale, both internal and external. Internal economies of scale occur within the firm, while external economies of scale arise from factors outside the firm, such as improved infrastructure or supplier networks.
- Diseconomies of Scale: The rise in long run average cost at higher levels of output is influenced by diseconomies of scale, which can be internal (such as management inefficiencies) or external (such as increased regulation or higher input costs).
Traditional vs. Modern Views
- Traditional View: The traditional economic analysis suggests a flattened "U" shaped LAC curve, assuming constant technology. However, this does not reflect the reality faced by modern firms.
- Modern View: Empirical evidence indicates that modern firms often experience an "L-shaped" long run average cost curve. In this scenario, as output increases as a result of plant expansion and associated variable factor increases, the per unit cost decreases rapidly due to economies of scale. The long run average cost does not increase even at large scales of output because firms continue to benefit from economies of scale.
Economies and Diseconomies of Scale
The Scale of Production
Large-scale production is a key characteristic of modern industrial society, leading to an increase in the size of business enterprises. This approach offers several advantages that contribute to lower production costs. Economies associated with large-scale production can be classified into two categories: internal economies and external economies.
Internal Economies
- Definition: Internal economies refer to the cost advantages that a firm experiences when it expands its output. These economies arise from factors within the firm and are exclusive to the expanding enterprise.
- Factors Contributing to Internal Economies:
- Entrepreneurial Efficiency: The skills and efficiency of the entrepreneur play a crucial role in reducing production costs.
- Managerial Talent: Effective management practices contribute to improved efficiency and lower costs.
- Machinery and Technology: The use of advanced and specialized machinery enhances production efficiency.
- Marketing Strategy: An effective marketing strategy can also contribute to cost reductions.
External Economies
- Definition: External economies are the benefits that accrue to all firms within an industry as a result of the industry’s expansion. These economies are not limited to individual firms but are shared by all members of the industry.
- Examples: External economies can arise from factors such as improved infrastructure, skilled labor availability, and industry-specific support services that benefit all firms in the sector.
Internal Economies and Diseconomies:
- Internal Economies: These occur when a firm experiences increasing returns to scale, leading to a decrease in costs. Initially, as a firm expands, it benefits from various internal efficiencies such as better resource utilization, enhanced productivity, and lower per-unit costs.
- Internal Diseconomies: Beyond a certain point, further expansion can lead to internal diseconomies of scale, where costs begin to rise. This can happen due to factors such as overstaffing, management challenges, and inefficiencies that arise from excessive size.
Technical Economies and Diseconomies:
- Technical Economies: Large-scale production allows for the use of superior techniques and specialized equipment. As a firm increases its scale of operations, it can employ more efficient machinery and technology, resulting in lower costs per unit. For instance, advanced machinery designed for high output levels can significantly reduce production costs.
- Division of Labour and Specialization: With increased scale, firms can implement a higher degree of division of labour and specialization, further reducing costs. This involves assigning specific tasks to workers based on their expertise, leading to improved efficiency and productivity.
Technical Diseconomies: However, there is a point where further expansion may lead to technical diseconomies. This can occur if the scale becomes too large for effective management of production processes, leading to inefficiencies and increased costs. For example, coordinating a very large workforce and complex production processes can become challenging, offsetting the benefits of scale.
(i) Economies of Scale
- Definition: Economies of scale refer to the cost advantages that a firm experiences as it increases its level of production. These advantages arise from the ability to spread fixed costs over a larger output, leading to a decrease in the average cost per unit.
- Types of Economies of Scale: Economies of scale can be classified into various types:
- Technical Economies: Large firms can use advanced and efficient production techniques, such as automatic machinery and assembly lines, which are not feasible for smaller firms. These techniques lead to lower production costs per unit.
- Managerial Economies: With increasing production, firms can afford to hire specialized managers for different functions (e.g., production, marketing, finance), leading to more efficient management and lower costs.
- Financial Economies: Larger firms often have better access to capital markets and can secure loans at lower interest rates, reducing their overall financial costs.
- Marketing Economies: Big firms can spread their marketing and advertising costs over a larger sales volume, reducing the cost per unit sold. They can also negotiate better deals with retailers due to their larger scale.
- Purchasing Economies: Large firms can buy raw materials and components in bulk at discounted prices, reducing their input costs.
(ii) Diseconomies of Scale
- Definition: Diseconomies of scale occur when a firm becomes too large, leading to an increase in the average cost per unit. This can happen due to various factors that hinder efficiency.
- Causes of Diseconomies of Scale: Diseconomies of scale can be caused by:
- Management Challenges: As firms grow, managing and coordinating various departments becomes more complex. Communication gaps and delays in decision-making can arise, negatively impacting efficiency.
- Bureaucracy: Larger firms may develop bureaucratic structures with excessive red tape, slowing down processes and increasing costs.
- Employee Morale: In very large organizations, employees may feel less connected to the company’s goals, leading to lower motivation and productivity.
- Flexibility: Big firms may find it harder to adapt to changes in the market or industry, resulting in missed opportunities and increased costs.
(iii) Managerial Economies and Diseconomies
- Managerial Economies: When a firm increases its output, it can apply specialization and division of labor to management. This means that management can be divided into specialized departments, each headed by personnel with expertise in that area, such as production, sales, and finance. As production scales up, each department can be further subdivided. For instance, the sales department can be split into advertising, exports, and customer service sections. This specialization improves management efficiency and productivity, leading to lower managerial costs. Additionally, decentralizing decision-making and automating managerial functions further enhance managerial efficiency.
- Managerial Diseconomies: However, if the scale of production continues to increase beyond a certain point, managerial diseconomies can set in. Communication between different levels of management and between managers and workers becomes challenging, resulting in delays in decision-making and implementation. Management finds it harder to exercise control and coordinate among various departments. The managerial structure becomes more complex, with increased bureaucracy, red tape, and longer communication lines, all of which negatively impact management efficiency and, consequently, the firm’s productivity.
(iv) Commercial Economies and Diseconomies
- Commercial Economies: Large firms benefit from commercial economies because they require substantial amounts of materials and components for production. They can place bulk orders for these inputs, resulting in lower prices. Additionally, large firms can achieve economies in marketing their products. If their sales staff is not fully utilized, they can sell additional output with little or no extra cost. This ability to spread costs over a larger volume contributes to lower average costs.
- Commercial Diseconomies: However, there are also commercial diseconomies associated with large-scale production. These may include challenges in managing and coordinating various commercial activities, potential increases in logistical complexities, and difficulties in maintaining relationships with suppliers and distributors at a larger scale.
(iv) Internal Economies and Diseconomies of Scale
(a) Technical Economies and Diseconomies: Large-scale production allows for the use of advanced and specialized machinery, which small firms may not afford. This leads to lower costs per unit. However, there is a limit; beyond a certain point, the complexity of managing such machinery can increase costs.
(b) Managerial Economies and Diseconomies: Big firms can hire specialized managers for different departments, improving efficiency. Small firms may not afford such specialization. But, after a certain scale, coordinating many specialized managers can become challenging and costly.
(c) Marketing Economies and Diseconomies: Large firms can spread advertising costs over a greater output, reducing per-unit costs. They can also sell by-products more easily. However, beyond an optimal scale, marketing and advertising expenses can rise disproportionately.
(d) Financial Economies and Diseconomies: Large firms have better access to finance, can offer more security to lenders, and raise capital at a lower cost due to their reputation. However, after a certain point, their reliance on external financing can increase costs.
(e) Risk-bearing Economies and Diseconomies: Large, diversified firms can better withstand economic fluctuations, enjoying economies of risk-bearing. However, if diversification increases risk rather than mitigates it, this can lead to diseconomies.
External Economies and Diseconomies
These arise from the growth of the industry as a whole, not from individual firms. For instance, with industry expansion, new sources of cheaper raw materials and capital equipment may emerge, benefiting all firms.
- Cheaper Raw Materials and Capital Equipment: Industry expansion can lead to the discovery of new, cost-effective sources for raw materials and machinery. This benefits all firms as they can reduce their input costs.
- Increased Demand for Materials and Equipment: As an industry grows, the demand for various materials and equipment increases, leading to economies of scale in their production. This can result in lower prices for these inputs, benefiting all firms in the industry.
External Economies of Scale
External economies of scale occur when a firm benefits from the growth and expansion of the industry as a whole. These benefits can arise from various factors, such as technological advancements, the development of skilled labor, and the growth of ancillary industries. Let's explore these in detail:
- Technological External Economies. When an entire industry expands, it can lead to the discovery of new technical knowledge and the adoption of improved machinery and processes. This enhances the technical coefficient of production, increasing productivity and reducing production costs for firms within the industry.
- Development of Skilled Labor. As an industry grows in a particular area, the local labor force becomes more familiar with various production processes and gains experience. This results in the development of a pool of trained labor, which positively impacts productivity and reduces costs for firms in the industry.
- Growth of Ancillary Industries. The expansion of an industry often leads to the growth of ancillary industries that specialize in providing raw materials, tools, machinery, and repair services. This increased competition among suppliers can lower input prices, benefiting all firms by reducing production costs. Additionally, new units may emerge for processing or recycling waste products, further reducing costs.
- Improved Transportation and Marketing Facilities. The entry of new firms into an industry can stimulate the development of efficient transportation and marketing networks. These improvements reduce production costs for firms by eliminating the need to establish and maintain these services individually. Enhanced communication systems can also facilitate faster and better information dissemination.
- Economies of Information. Firms can access necessary information regarding technology, labor, prices, and products more easily and cheaply due to the publication of information booklets and bulletins by industry associations or governments in the public interest.
However, external economies of scale can be undermined by external diseconomies, which are disadvantages that arise outside the firm, particularly in input markets. For example, when an industry expands, the demand for various factors of production such as raw materials, capital goods, and skilled labor increases. This heightened demand can put pressure on input markets, leading to an increase in factor prices, thereby negating the benefits of external economies.
When there is a shortage of resources, it can be problematic for firms. Additionally, having too many companies in the same industry in one location can lead to increased costs for transportation, marketing, and pollution control. The government also has the power to restrict or prohibit the expansion of an industry in a specific area through its location policy.
|
86 videos|200 docs|58 tests
|
FAQs on Unit 2: Theory of Cost Chapter Notes - Business Economics for CA Foundation
| 1. What is a cost function and why is it important in economics? |  |
| 2. What are short run total costs and how do they differ from long run costs? |  |
| 3. What is the long run average cost curve and what does it represent? |  |
| 4. What are economies of scale and how do they benefit firms? |  |
| 5. What are diseconomies of scale and how can they impact a business? |  |


