Class 8 Maths - Data Handling CBSE Worksheets Solutions
| Table of contents |
|
| Frequency Table |
|
| Bar Graphs |
|
| Pie Charts |
|
| Chance and Probability |
|
Frequency Table
Q1: The weekly wages (in Rs.) of 30 workers in a factory are: 830, 835, 890, 810, 835, 836, 869, 845, 898, 890, 820, 860, 832, 833, 855, 845, 804, 808, 812, 840, 885, 835, 835, 836, 878, 840, 868, 890, 806, 840.
Using tally marks, make a frequency table with intervals as 800 – 810, 810 – 820 and so on.
Ans: The frequency table with intervals as 800 – 810, 810 – 820 and so on, using tally marks is given below:

Bar Graphs
Q1: The number of hours for which students of a particular class watched television during holidays is shown through the given graph. Answer the following:
(i) For how many hours did the maximum number of students watch T.V.?
(ii) How many students watched TV for less than 4 hours?
(iii) How many students spent more than 5 hours watching TV?
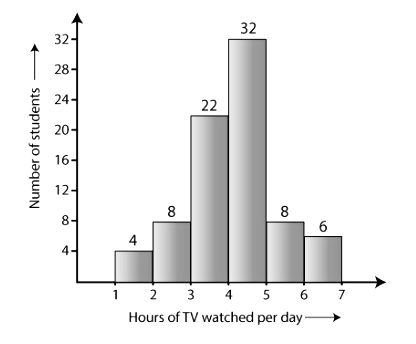
Ans: (i) 32 students watched T.V for 4-5 hours.
Therefore, the maximum number of students who watched T.V. for 4 – 5 hours.
(ii) The number of students who watched T.V. less than 4 hours = 22 + 8 + 4 = 34
(iii) The number of students who spent more than 5 hours watching TV = 8 + 6 = 14
Pie Charts
Q1: A survey was made to find the type of music that a certain group of young people liked in a city. The adjoining pie chart shows the findings of this survey. From this pie chart, answer the following:
(i) If 20 people liked classical music, how many young people were surveyed?
(ii) Which type of music is liked by the maximum number of people?
(iii) If a cassette company were to make 1000 CD’s, how many of each type would they make?
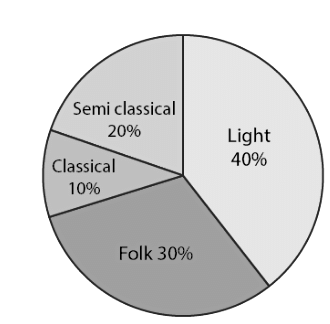
Ans: (i) 10% represents 20 people.
⟹100% represents = (100 x 20)/10 = 200
Therefore, 200 people were surveyed.
(ii) Since 40% of the total people surveyed liked light music and no other form of song liked more than that, we can conclude that the maximum number of people likes light music.
(iii) CD’s of classical music = (10 x 1000)/100 = 100
CD’s of semi-classical music = (20 x 1000)/100 = 200
CD’s of light music = (40 x 1000)/100 = 400
CD’s of folk music = (30 x 1000)/100 = 300
Q2: The adjoining pie chart gives the marks scored in an examination by a student in Hindi, English, Mathematics, Social Science and Science. If the total marks obtained by the students were 540, answer the following questions.
(i) In which subject did the student score 105 marks?
(ii) How many more marks were obtained by the student in Mathematics than in Hindi?
(iii) Examine whether the sum of the marks obtained in Social Science and Mathematics is more than that in Science and Hindi.
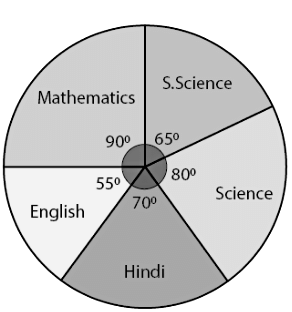
Ans:
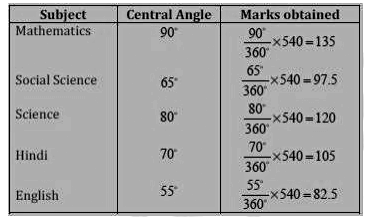
(i) The student scored 105 marks in Hindi.
(ii) Marks obtained in Mathematics = 135 Marks obtained in Hindi = 105
Difference = 135 – 105 = 30
Thus, 30 more marks were obtained by the student in Mathematics than in Hindi.
(iii) The total marks obtained in Social Science and Mathematics = 97.5 + 135 = 232.5
The total marks obtained in Science and Hindi = 120 + 105 = 225
Therefore, the sum of the marks in Social Science and Mathematics is more than that in Science and Hindi.
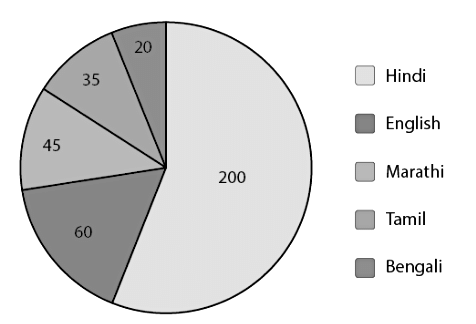
Q3: The number of students in a hostel, speaking different languages is given below. Display the data in a pie chart.
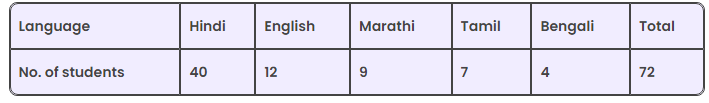
Ans:
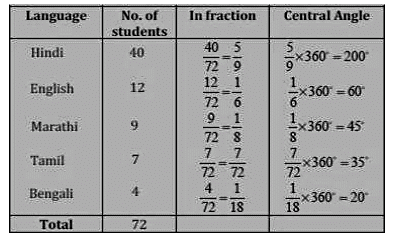
The pie-chart for the above data will be:
Chance and Probability
Q1: When a die is thrown, list the outcomes of an event of getting:
(i)
(a) a prime number
(b) not a prime number
(ii)
(a) a number greater than 5
(b) a number not greater than 5.
Ans:
(i)
(a) Outcomes of the event to get a prime number are 2, 3 and 5.
(b) Outcomes of an event of not getting a prime number are 1, 4 and 6.
(ii)
(a) Outcomes of the event of getting a number greater than 5 are 6.
(b) Outcomes of the event of not getting a number greater than 5 are 1, 2, 3, 4 and 5.
Q2: Numbers 1 to 10 are written on ten separate slips (one number on one slip), kept in a box and mixed well. One slip is chosen from the box without looking into it. What is the probability of:
(i) getting a number 6?
(ii) getting a number less than 6?
(iii)getting a number greater than 6?
(iv)getting a 1-digit number?
Ans:
(i) The outcome of getting a number 6 from ten separate slips is one.
Therefore, the probability of getting a number 6 = 1/10
(ii) Numbers which are less than 6 are 1, 2, 3, 4 and 5. So total there are five numbers. Thus, there are 5 outcomes.
Therefore, the probability of getting a number less than 6 = 5/10 = ½
(iii) The number is greater than 6 out of ten that are 7, 8, 9, 10. So there are 4 possible outcomes.
Therefore, the probability of getting a number greater than 6 = 4/10 = ⅖
(iv) One digit numbers out of 1 to 10 are 1, 2, 3, 4, 5, 6, 7, 8, 9.
Therefore, the probability of getting a 1-digit number = 9/10
Q3: If you have a spinning wheel with 3 green sectors, 1 blue sector and 1 red sector, what is the probability of getting a green sector? What is the probability of getting a non-blue sector?
Ans: A total of five sectors are present. Out of the five sectors, three sectors are green.
Therefore, the probability of getting a green sector = ⅗
Out of the five sectors, one sector is blue.
Hence, Number of Non-blue sectors = 5 – 1 = 4 sectors
Therefore, the probability of getting a non-blue sector will be equal to 4/5.
|
79 videos|408 docs|31 tests
|
FAQs on Class 8 Maths - Data Handling CBSE Worksheets Solutions
| 1. How can data handling be applied in real-life situations? |  |
| 2. What are the different types of data handling techniques? | |
| 3. How does data handling help in improving decision-making processes? | |
| 4. What are the benefits of using data handling tools and software? | |
| 5. How can individuals improve their data handling skills? | |

|
4.95/5 Rating |

|
Dec 22, 2024 Last updated |

|
Explore Courses for Class 8 exam
|
|
mock tests for examination
,Class 8 Maths - Data Handling CBSE Worksheets Solutions
,Previous Year Questions with Solutions
,ppt
,Class 8 Maths - Data Handling CBSE Worksheets Solutions
,Semester Notes
,shortcuts and tricks
,Viva Questions
,Objective type Questions
,Free
,Exam
,Class 8 Maths - Data Handling CBSE Worksheets Solutions
,study material
,Summary
,Extra Questions
,past year papers
,MCQs
,video lectures
,Sample Paper
,Important questions
,practice quizzes
;


Worksheet Solutions: Data Handling Free PDF Download
Importance of Worksheet Solutions: Data Handling
Worksheet Solutions: Data Handling Notes
Worksheet Solutions: Data Handling Class 8 Questions
Study Worksheet Solutions: Data Handling on the App
|
© EduRev
|
Education Revolution
|


|


