Class 9 Maths Chapter 13 Previous Year Questions - Statistics

Very Short Answer Type Questions
Q1. The median of the following numbers arranged in descending order is 25. Find the value of [2025]
x: 40, 38, 35, 2x + 10, 2x + 1, 15, 11, 8, 5
Sol:
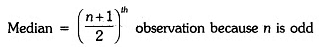
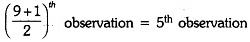
Number of observations = 9
∴ The median is the ((n+1)/2)th term i.e. ((9+1)/2) th or the 5th term.
⇒ 2x + 1 = 25
⇒ x= (25-1)/2= 12
Q2. If the mean of 6, x, 4, and 12 is 8, then find the value of x. [2024]
Sol:
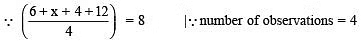
∴  = 8 or 22 + x = 32or x = 32 – 22 = 10
Q3. Find the range of the data 9, 7, 5, 7, 9, 9, 6, 18, 9 and 8. [2023]
Sol:
Highest data = 18
Lowest data = 5
⇒ Range = 18 – 5 = 13
Q4. What is the median of 70, 40, 50, 100, 75, 75, 65 and 95? [2022]
Sol:
In ascending order, the given data is:
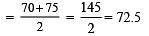
40, 50, 65, 70, 75, 75, 95, 100
Here, n = 8 (Even number)
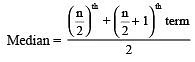
⇒ Median = 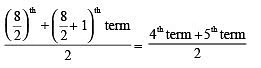
Short Answers Type Questions
Q1. Find the range and prepare a frequency table for the following observations: [2025]
4, 1, 1, 2, 3, 5, 2, 3, 3, 1, 2, 2, 4, 2, 5, 4, 1, 1, 3, 2
Sol:
Arranging the observations in an ascending order:
1, 1, 1, 1, 1, 2, 2, 2, 2, 2, 2, 3, 3, 3, 3, 4, 4, 4, 5, 5
Lowest observation = 1
Highest observation = 5
∴ Range = 5 – 1 = 4
Thus, the required range = 4.
Frequency table:
Observation | Tally marks | Frequency |
1 |
| 5 |
2 |
| 6 |
3 | IIII | 4 |
4 | III | 3 |
5 | II | 2 |


Q2. Form a frequency table for the following: [2024]
| Marks obtained | Number of students |
| More than 50 More than 40 More than 30 More than 20 More than 10 More than 0 | 0 20 37 44 46 50 |
Sol:
| Marks obtained | Frequency | Cumulative frequency |
| 0–10 10–20 20–30 30–40 40–50 | 50 – 46 = 4 46 – 44 = 2 44 – 37 = 7 37 – 20 = 17 20 – 0 = 20 | 4 6 13 30 50 |
| Total | 50 |
Q3. If the mean of the following data is 15 then find the value of p. [2023]
| xi | 5 | 10 | 15 | 20 | 25 |
| fi | 6 | 4 | 5 | p | 7 |
Sol:
We can have the following table from the given data :
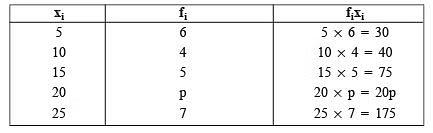
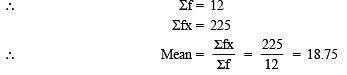
∴ we have ∑ (fi) = 6+4+5+p+7 = 22+p
∑ (xifi) = 30+40+75+20p+175 = 320+20p
∵ Mean, 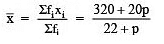
But Mean = 15
∴ 
⇒ 320 + 20p = 15(22 + p)
⇒ 320 + 20p = 330 + 15p
⇒ 20p – 15p = 330 – 320
⇒ 5p = 10
⇒ p= (10/5)= 2
Thus, the required value of p is 2
Q4. The mean of 40 numbers was found to be 35. Later on, it was detected that a number 56 was misread as 16. Find the correct mean of the given numbers. [2022]
Sol:
Number of observations = 40
∵ Calculated mean = 35
∴ Calculated sum = 40 x 35 = 1400
Since the number 56 is misread as 16.
∴ Correct sum of the numbers = 1400 – [Wrong observation] + [Correct observation]
= 1400 – [16] + [56]
= (1400 – 16 + 56) = 1440
∴ The correct mean =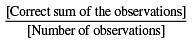
= (14440/40)= 36
Thus, the correct mean = 36.
Q5. A train travels between two stations x and y. While going from x to y, its average speed is 72 km per hour, and while coming back from y to x, its average speed is 63 km per hour. Find the average speed of the train during the whole journey. [2021]
Sol:
Let the distance between x and y is s km.
Since, average speed = Total Distance / Total Time
For the train going from x to y, Average speed = 72 km/hr
∴ Time taken = Distance / speed = s/72 hours
For the train coming back from y to x, Average speed = 63 km/hr
∴ Time taken = Distance / speed = s/63 hours
Now, the total time taken to cover 2s km
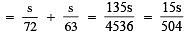
∴ Average speed during the whole journey 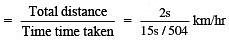
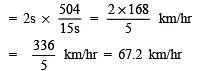
Thus, the required average speed = 67.2 km/hr.
Long Answer Type Questions
Q1: Ten observations 6, 14, 15, 17, x + 1, 2x – 13, 30, 32, 34, 43 are written in ascending order. The median of the data is 24. Find the value of x. [2025]Sol:
Here, the arranged data is 6, 14, 15, 17, x + 1, 2x – 13, 30, 32, 34, 43
Total number of observations = 10
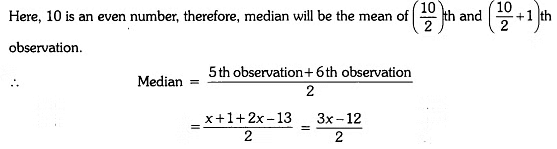
But median of data is 24 (given)
⇒ 3x−12 / 2 = 24
⇒ 3x – 12 = 48
⇒ 3x = 60
⇒ x = 20
∴ The value of x = 20
Q2: Given are the scores (out of 25) of 9 students in a Monday test :
14, 25, 17, 22, 20, 19, 10, 8 and 23
Find the mean score and median score of the data. [2023]
Sol:
Ascending order of scores is :
8, 10, 14, 17, 19, 20, 22, 23, 25
Now, Mean Score = 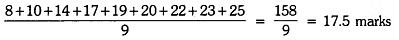
 =
=  = 19 marks
Q3: The weight in grams of 35 mangoes picked at random from a consignment are as follows:
131, 113, 82, 75, 204, 81, 84, 118, 104, 110, 80, 107, 111, 141, 136, 123, 90, 78, 90, 115, 110, 98, 106, 99, 107, 84, 76, 186, 82, 100, 109, 128, 115, 107, 115 From the grouped frequency table by dividing the variable range into interval of equal width of 20 grams, such that the mid-value of the first class interval is 70 g. Also, draw a histogram. [2021]
Sol:
It is given that the size of each class interval = 20 and the mid-value of the first class interval is 70.
Let the lower limit of the first class interval be a, then its upper limit = a + 20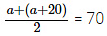 ⇒ a = 70 – 10 = 60
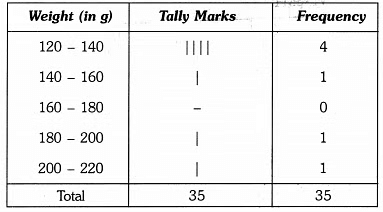
Thus, the first class interval is 60 – 80 and the other class-intervals are 80 – 100, 100 – 120, 120 – 140, 140 – 160, 160 – 180, 180 – 200 and 200 – 220.
So, the grouped frequency table is as under :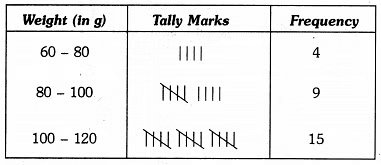
Let us represent weight (in g) along x-axis and corresponding frequencies along y-axis on a suitable scale, the required histogram is as under :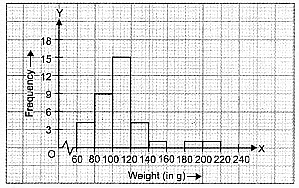
Q4: The following two tables gives the distribution of students of two sections according to the marks obtained by them :
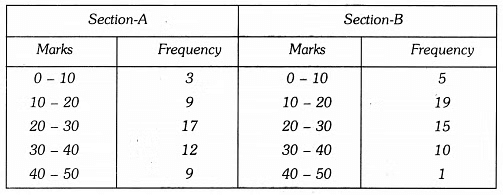
Represent the marks of the students of both the sections on the same graph by two frequency polygons. From the two polygons compare the performance of the two sections. [2020]
Sol:
The class marks are as under :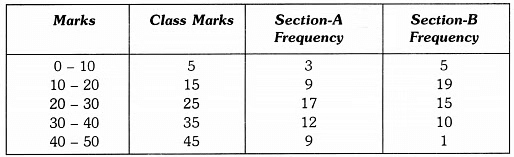
Let us take class marks on X-axis and frequencies on Y-axis. To plot frequency polygon of Section-A, we plot the points (5, 3), (15, 9), (25,17), (35,12), (45, 9) and join these points by (15,19). line segments. To plot frequency polygon of Section-B, we plot the points (5, 5), (15, 19), (25, 15), (35, 10), (45, 1) on the same scale and join these points by dotted line segments.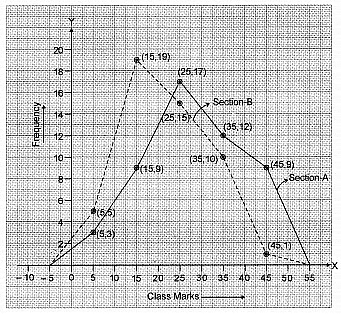
From the above two polygons, clearly the performance of Section A is better.
|
40 videos|471 docs|57 tests
|
FAQs on Class 9 Maths Chapter 13 Previous Year Questions - Statistics
| 1. What is the importance of statistics in research and data analysis? |  |
| 2. What are the different types of statistical methods used in analysis? | |
| 3. How do you interpret a p-value in hypothesis testing? | |
| 4. What is the difference between a population and a sample in statistics? | |
| 5. What are common applications of statistics in everyday life? | |


Extra Questions
,video lectures
,Previous Year Questions with Solutions
,Summary
,Free
,mock tests for examination
,Objective type Questions
,Exam
,ppt
,Important questions
,MCQs
,Class 9 Maths Chapter 13 Previous Year Questions - Statistics
,shortcuts and tricks
,Sample Paper
,study material
,Class 9 Maths Chapter 13 Previous Year Questions - Statistics
,practice quizzes
,Semester Notes
,past year papers
,Class 9 Maths Chapter 13 Previous Year Questions - Statistics
,Viva Questions
;


Previous Year Questions : Statistics Free PDF Download
Importance of Previous Year Questions : Statistics
Previous Year Questions : Statistics Notes
Previous Year Questions : Statistics Class 9
Study Previous Year Questions : Statistics on the App
|
© EduRev
|
Education Revolution
|


|


