Collection & Presentation of Data | General Aptitude for GATE - Mechanical Engineering PDF Download
We come across a lot of information every day from different sources. Our newspapers, TV, Phone and the Internet, etc are the sources of information in our life. This information can be related to anything, from bowling averages in cricket to profits of the company over the years. These facts and figures are often numerical and are called Data. Statistics is the study of data. Let’s look into this in detail.
Statistics – Collection and Presentation of Data
Before going into Statistics, first, let’s define what is Data.
“Data are units of information, often numeric, collected through observation.” It is plural form of the Latin word “Datum”.
Our world has become very information-oriented in the past two decades. So, it becomes essential for us to extract meaningful information out of data. For that we need statistics. Let’s see what statistics mean in formal terms.
Statistics is derived from Latin word “Status” which means “a state”. It concerns with the nature, meaning and distribution of the data.
Collection of Data
Collection of data refers to collecting information about something with an objective to analyze it or extract some meaningful information from it. Some examples of activities involving the collection of data are:
- Students collecting data from their localities about the number of people with Covid Vaccines.
- A Football fan collecting information about the goals scored by his favorite player.
- A record company collecting information about album sales by their artists.
Types of Recorded Data
Most of the time when we collect data for our experiment with an objective. It usually falls into one of these two categories:
- Categorical Data
- Numerical Data
1. Categorical Data
This data represents the characteristics of something entity. For example, if we are collecting data about some people. Categorical data related to this information might be, gender of the person, marital status, etc. These things will have values that are not numerical, often “Yes/No” or in this case “Male/Female”. Since they are not numerical, they cannot be added together.
2. Numerical Data
This data comes out of measurement and is numerical in nature. For example, Weight of the person, stock prices, marks of students of class XII, etc. This data is also called quantitative data. It can be broken down further into types:
- Continuous Data
- Discrete Data
Continuous Data: This data can take any value between intervals. The number of possible values for this data cannot be counted. For example Length of a ruler can take any length between 0-100cm. It can be either 30cm, 30.11cm and so on. There are infinitely many possible values.
Discrete Data: This data takes only certain values. For example: If a coin is tossed three times, and we want to count the number of heads. There are only a handful of values that are possible. 0,1,2 or 3. It cannot take 2.2 or any other value. So, there are only finite possible values.
Presentation of Data
After collecting the data, we need to present it in a meaningful way. Let’s take an example,
Suppose we have the data of heights of students in a class,
140, 161, 152, 184, 135, 168 and 144.
We need to answer the following questions related to the data:
- What is the height of the longest student in the class?
- What is the height of the shortest student in the class?
- What is the average height?
It is a little difficult to analyze the data in this format. The data in the form is called raw data. Analyzing the data in this form might take more time if the data is big. It can be made a little easier if sort the data in ascending or descending order. Thus, in this way, the presentation of data affects the information and the time taken to extract it from the data.
Suppose if this data was even bigger, then it would be very difficult to organize the data in sorted order. In such cases, we might use a frequency table. Let’s see this through an example.
Un-Grouped Frequency Distribution
In this type of frequency table, we consider the values as it is and then count their number of occurrences in the data. We don’t group the data. Let’s see this through an example.
Question: Let’s say we have marks of students of class XII. The marks are out of 40.
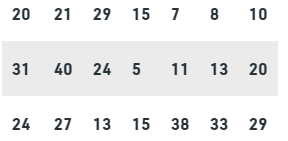
Represent this data using a frequency table.
Solution:
Let’s take marks of some student in one column and frequency of such marks in another column.
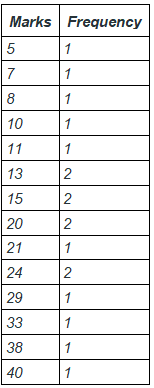
Notice that in this table, we have not grouped the data instead we have taken exact values and their frequency. So, this type of representation is called ungrouped frequency distribution.
Grouped Frequency Distribution
The previous kind of representation is definitely an improvement over previous representations but as seen in the above example, tables can get pretty big in such representations. Tally Marks and grouping can also be used to represent this data.
Question: We have the data for the number of covid cases on a particular day in 20 cities.
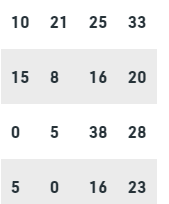
Represent this data using a frequency table.
Solution:
In the previous example we saw that ungrouped frequency distribution is cumbersome and very long to look at. So now, we will divide the data into groups. This kind of frequency table representation is called grouped frequency representation.
Let’s divide the numbers of cases in the groups like, 0-5, 5-10, 10-15 … and so on.
Then the frequency table will become,
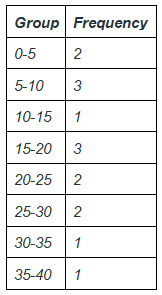
The intervals like 0-5, 5-10 .. And so on given in the above example are called class intervals. The larger number is called higher limit and the lower number is called the lower limit.
Let’s see some sample problems on these concepts
Sample Problems
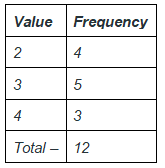
Problem 1: The table below represents the data. Represent this data in the form of suitable frequency distribution.

Solution:
We can see from the data given above, that there are only three values – 2,3 and 4. These values occur multiple times throughout the data. Since there are very less number of values, we can represent this kind of data in the form un-grouped frequency table.
Problem 2: The data given below represents the blood groups of the 20 students of class XI.
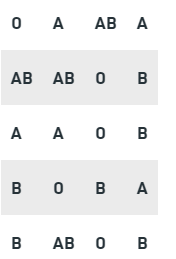
Represent the data given above in the table in the form of a frequency table. Which of the following blood group has the highest frequency among the students?
Solution:
We know there are four types of blood groups in the table.
O, A, AB and B
So, we will use ungrouped frequency distribution table to represent the data.
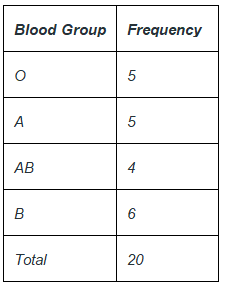
From the frequency distribution table we can tell the B is the blood group which most commonly occurring in students.
Problem 3: The table represents the weights of the students of class X.
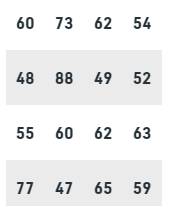
Answer the following questions:
- What is the range in which most students lie?
- Suppose students weighing more than 70 are considered overweight and those weighing less than 50 are considered as underweight. How many such students are there in the class?
Solution:
Let’s make a grouped frequency distribution table for this data.
Assuming intervals like 0-10,10-20…and so on. Let’s divide the data into these intervals are count the frequency.
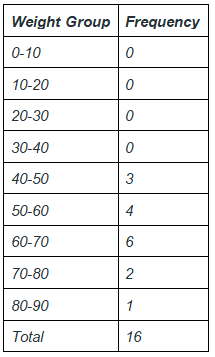
This above table represents a grouped frequency table. Now answering the questions.
1. Most students lie in the range from 60-70.
2. For overweight students, we need to count the number of students with weight greater than 70. It can be observed from the table that there are three such students.
For underweight students, the number students with weight less than 50 are also three students.
Problem 4: Three coins are tossed 20 times. The number of heads that occurred each time is recorded and given in this data below. Prepare a frequency distribution for the given data.

Solution:
We know there are maximum of three heads possible at each turn in this experiment. So we can actually make an ungrouped frequency distribution for such data
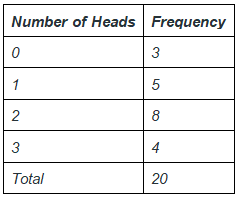
Thus, the table above represents the frequency table for this data.
|
193 videos|169 docs|152 tests
|
FAQs on Collection & Presentation of Data - General Aptitude for GATE - Mechanical Engineering
| 1. What is the importance of data collection and presentation? |  |
| 2. What are some common methods of data collection? |  |
| 3. How can data be presented effectively? |  |
| 4. What are the challenges associated with data collection and presentation? |  |
| 5. How does data collection and presentation contribute to decision-making? |  |


