Column and Bar Graph | IBPS PO Prelims & Mains Preparation - Bank Exams PDF Download
| Table of contents |
|
| Definition |
|
| Key Components |
|
| Types of Bar Graphs |
|
| Constructing a Bar Graph |
|
| Solving Bar Graph Questions |
|
| Solved Example |
|

Definition
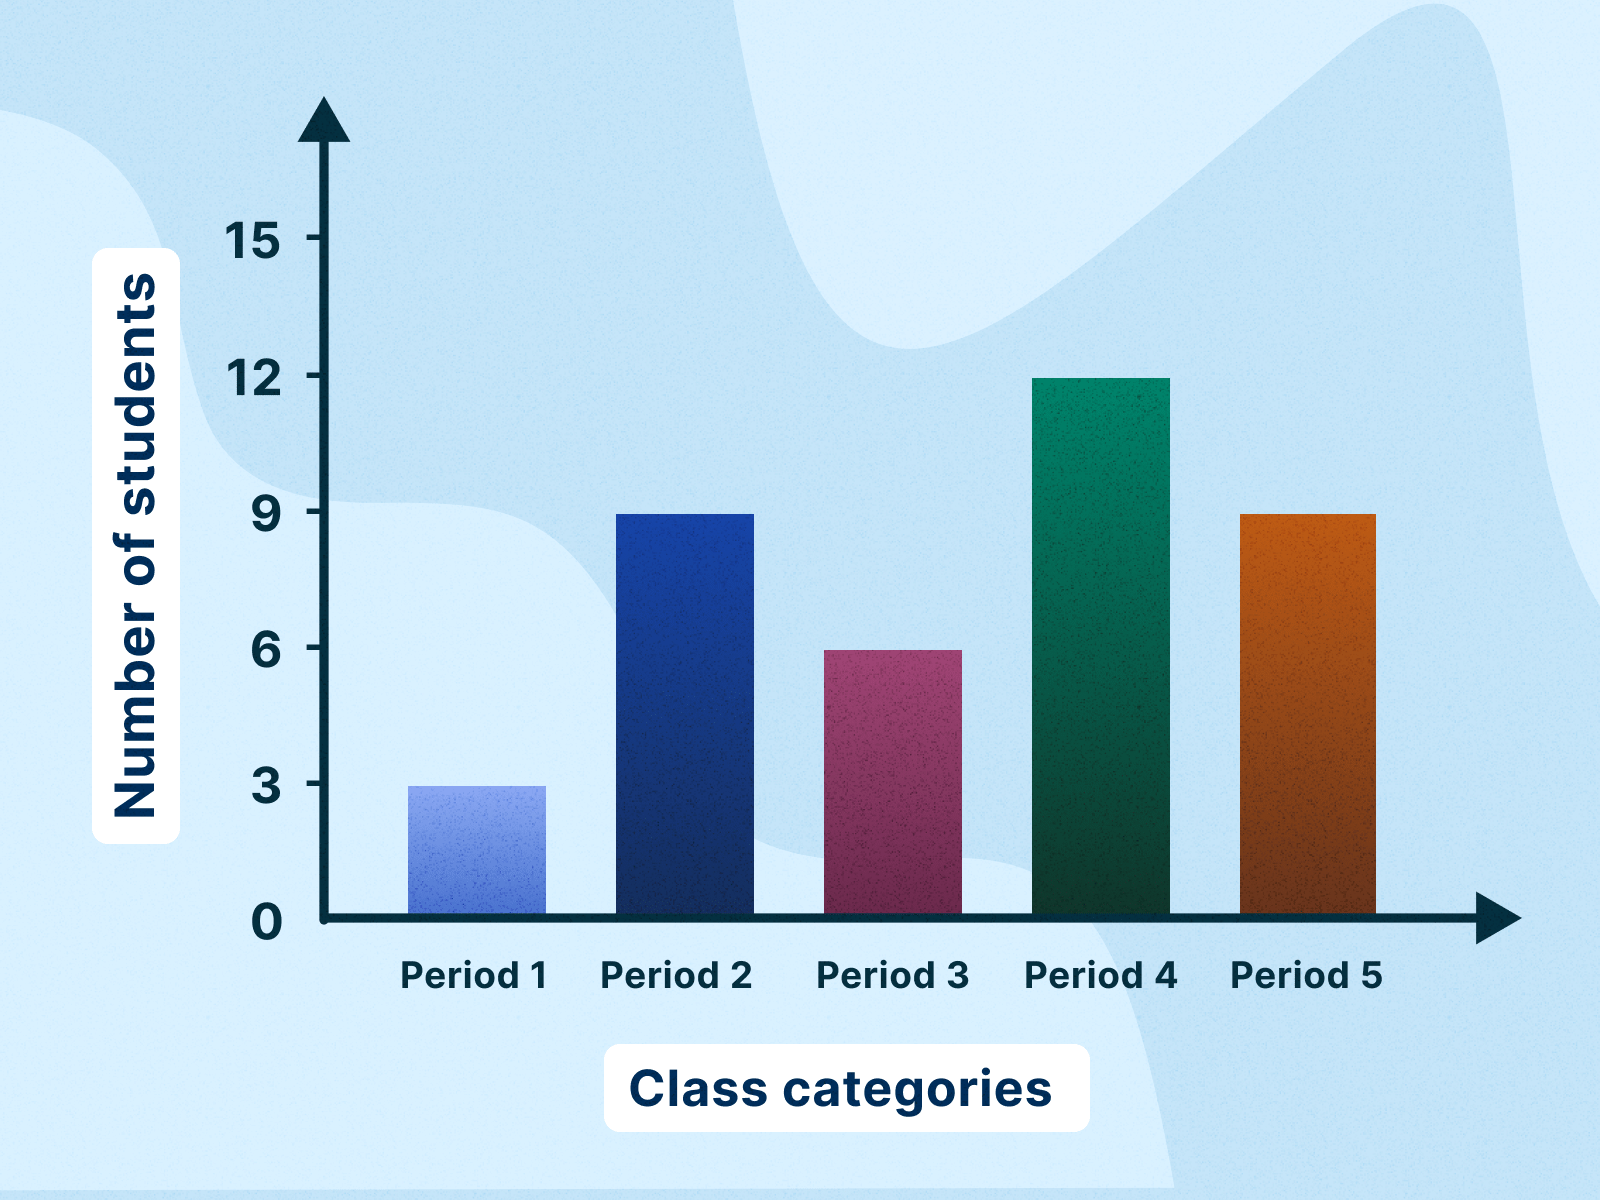
- A Bar graph is a visual tool that uses bars of varying lengths or heights to represent and compare data across different categories.
- Its primary function is to provide a clear, visual comparison of data values.
- Both bar and column graphs are visual tools used to represent and compare categorical data. They display data as rectangular bars, where the length or height of each bar is proportional to the value it represents.
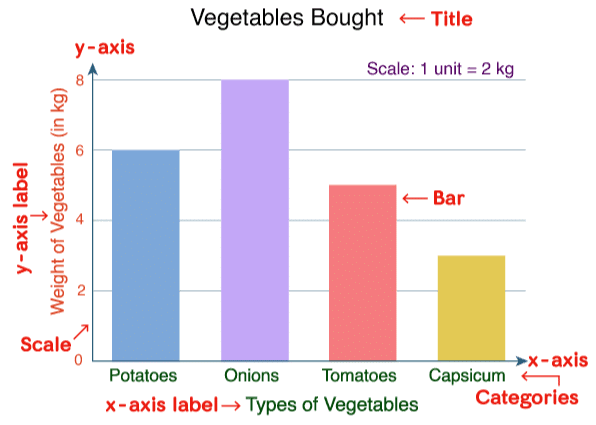
Key Components
Axes
- X-axis (Horizontal): Displays the categorical data being compared.
- Y-axis (Vertical): Represents the numerical values or frequencies associated with each category.
Bars
- Each bar corresponds to a specific category.
- The length or height of a bar is directly proportional to the value it represents.
- Bars can be oriented vertically or horizontally.
Labels
- Axis labels clarify the meaning of the data.
- Bar labels specify the categories.
Spacing
- Space between bars ensures clear distinction between categories.
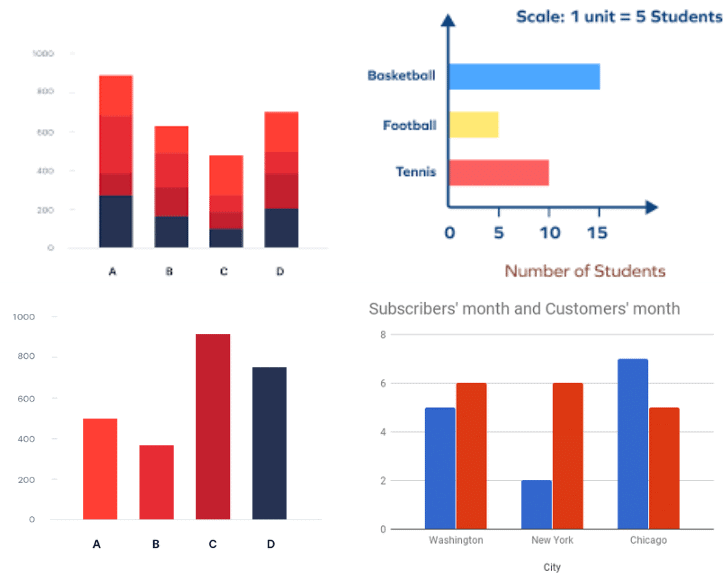
Types of Bar Graphs
- Vertical Bar Graph: Bars extend upwards from the x-axis.
- Horizontal Bar Graph: Bars extend sideways from the y-axis.
- Grouped Bar Graph: Compares multiple data sets within each category, displayed side-by-side.
- Stacked Bar Graph: Shows parts of a whole within each category, where each bar represents the total.
Constructing a Bar Graph
- Identify Variables: Determine the categorical (x-axis) and numerical (y-axis) data.
- Organize Data: Collect and group the data appropriately.
- Determine Scale: Choose a suitable, evenly spaced scale for the y-axis.
- Draw Axes: Create the x and y axes and label them.
- Plot Bars: Draw bars representing each category's value.
- Label Graph: Add a title, category labels, and optional value labels.
Solving Bar Graph Questions
- Read Title and Labels: Understand the graph's context and data representation.
- Examine Bars: Analyze the lengths or heights of the bars.
- Understand Scale: Interpret the y-axis scale accurately.
- Analyze Data: Compare bars to identify trends and variations.
- Interpret Questions: Understand the specific information requested.
- Use Mathematical Operations: Perform calculations like averages or percentages if needed.
- Verify and Double-check: Ensure your answers are accurate and aligned with the graph's data.
Solved Example
Directions: Study the graph carefully and answer the following questions.
The bar graph shows the total number of employees and the male employees in five different banks
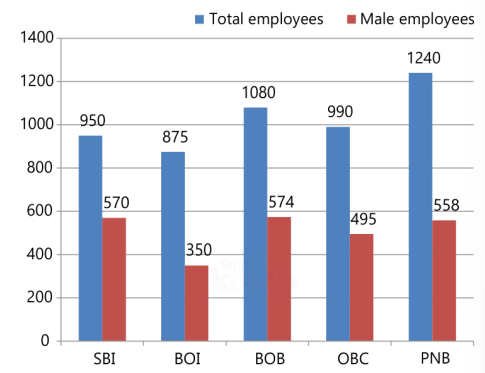
1. The number of female employees working in OBC and PNB together is approximately how much percentage less than the total number of employees working in PNB?
Solution:
The number of female employees working in OBC = 990 – 495 = 495
The number of female employees working in PNB = 1240 – 558 = 682
The number of total employees working in PNB = 1240% less = (1240−495−682)/ 1240 x 100 = 5.08% ≈ 5%
2. What is the average number of female employees working in all the banks?
Solution:
Female employees working in SBI = 950 – 570 = 380
Female employees working in BOI = 875 – 350 = 525
Female employees working in BOB = 1080 – 574 = 506
Female employees working in OBC = 990 – 495 = 495
Female employees working in PNB = 1240 – 558 = 682
Avg. no. of female employees = (5380+525+506+495+682)/5
= 2588/5 = 517.6
3. What is the ratio of number of male employees who are working in SBI and BOI together to the number of female employees who are working in same bank?
Solution:Male employees working in SBI = 570
Male employees working in BOI = 350
Female employees working in SBI = 950 – 570 = 380
Female employees working in BOI = 875 – 350 = 525
Ratio = 570 + 350 : 380 + 525
= 920 : 905
= 184 : 181
4. The total number of employees who are working in BOM is 80% of the total number of employees who are working in BOB. Find the percentage of female employees who are working in BOM if the number of male employees is 648.
Solution:
Total number of employees who are working in BOB = 1080
Total number of employees who are working in BOM = 1080 x 80% = 864
% of male employees = 648/864 x 100 = 75%
Percentage of female employees = 100 – 75% = 25%
Solution:Female employees who are working in SBI = 950 – 570 = 380
Female employees who are post graduate = 380 x 30% = 114
Female employees who are not post graduate = 380 – 114 = 266
|
647 videos|1019 docs|305 tests
|
FAQs on Column and Bar Graph - IBPS PO Prelims & Mains Preparation - Bank Exams
| 1. What is a bar graph and its purpose? |  |
| 2. What are the key components of a bar graph? | |
| 3. What are the different types of bar graphs? | |
| 4. How do you construct a bar graph? | |
| 5. What are some common questions that can be solved using bar graphs? | |


video lectures
,mock tests for examination
,ppt
,shortcuts and tricks
,Important questions
,Sample Paper
,Viva Questions
,Extra Questions
,MCQs
,Previous Year Questions with Solutions
,Column and Bar Graph | IBPS PO Prelims & Mains Preparation - Bank Exams
,Semester Notes
,past year papers
,Column and Bar Graph | IBPS PO Prelims & Mains Preparation - Bank Exams
,study material
,Summary
,Exam
,Column and Bar Graph | IBPS PO Prelims & Mains Preparation - Bank Exams
,Free
,Objective type Questions
,practice quizzes
;


Column and Bar Graph Free PDF Download
Importance of Column and Bar Graph
Column and Bar Graph Notes
Column and Bar Graph Bank Exams Questions
Study Column and Bar Graph on the App
|
© EduRev
|
Education Revolution
|


|


