ICAI Notes: Correlation And Regression- 2 - CA Foundation PDF Download
SUMMARY
The change in one variable is reciprocated by a corresponding change in the other variable either directly or inversely, then the two variables are known to be associated or correlated.
There are two types of correlation.
(i) Positive correlation
(ii) Negative correlation
We consider the following measures of correlation:
(a) Scatter diagram: This is a simple diagrammatic method to establish correlation between a pair of variables.
(b) Karl Pearson’s Product moment correlation coefficient:
A single formula for computing correlation coefficient is given by
(i) The Coefficient of Correlation is a unit-free measure.
(ii) The coefficient of correlation remains invariant under a change of origin and/or scale of the variables under consideration depending on the sign of scale factors.
(iii) The coefficient of correlation always lies between –1 and 1, including both the limiting values i.e. –1 ≤ r ≤ + 1
(c) Spearman’s rank correlation co-efficient: Spearman’s rank correlation coefficient is given by where rR denotes rank correlation coefficient and it lies between – 1 and 1 inclusive of these two values.di = xi – yi represents the difference in ranks for the i-th individual and n denotes the number of individuals.
In case u individuals receive the same rank, we describe it as a tied rank of length u.
In case of a tied rank,
In this formula, tj represents the jth tie length and the summation extends over the lengths of all the ties for both the series.
(d) Co-efficient of concurrent deviations: The coefficient of concurrent deviation is given by
If (2c–m) >0, then we take the positive sign both inside and outside the radical sign and if (2c–m) <0, we are to consider the negative sign both inside and outside the radical sign.
- In regression analysis, we are concerned with the estimation of one variable for given value of another variable (or for a given set of values of a number of variables) on the basis of an average mathematical relationship between the two variables (or a number of variables).
- In case of a simple regression model if y depends on x, then the regression line of y on x in given by y = a + b, here a and b are two constants and they are also known as regression parameters. Furthermore, b is also known as the regression coefficient of y on x and is also denoted by byx
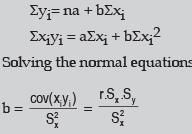
- The method of least squares is solving the equations of regression lines
The normal equations are

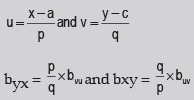
- The regression coefficients remain unchanged due to a shift of origin but change due to a shift of scale. This property states that if the original pair of variables is (x, y) and if they are changed to the pair (u, v) where

- The two lines of regression intersect at the point , where x and y are the variables under consideration.
According to this property, the point of intersection of the regression line of y on x and the regression line of x on y is i.e. the solution of the simultaneous equations in x and y. - The coefficient of correlation between two variables x and y in the simple geometric mean of the two regression coefficients. The sign of the correlation coefficient would be the common sign of the two regression coefficients.

- Correlation coefficient measuring a linear relationship between the two variables indicates the amount of variation of one variable accounted for by the other variable. A better measure for this purpose is provided by the square of the correlation coefficient, Known as ‘coefficient of determination’. This can be interpreted as the ratio between the explained variance to total variance i.e.

- The ‘coefficient of non-determination’ is given by (1–r2) and can be interpreted as the ratio of unexplained variance to the total variance.
- The two lines of regression coincide i.e. become identical when r = –1 or 1 or in other words, there is a perfect negative or positive correlation between the two variables under discussion. If r = 0 Regression lines are perpendicular to each other.
FAQs on ICAI Notes: Correlation And Regression- 2 - CA Foundation
| 1. What is correlation and regression? |  |
| 2. How is correlation coefficient calculated? |  |
| 3. What is the difference between positive and negative correlation? |  |
| 4. How is regression used in forecasting? |  |
| 5. Can correlation imply causation? |  |

|
Explore Courses for CA Foundation exam
|

|


