ICAI Notes: Correlation And Regression- 1 - CA Foundation PDF Download
This property says that if the two regression coefficients are denoted by byx (=b) and bxy (=b’) then the coefficient of correlation is given by
18.1 INTRODUCTION:- In the previous chapter, we discussed many a statistical measure relating to Univariate distribution i.e. distribution of one variable like height, weight, mark, profit, wage and so on. However, there are situations that demand study of more than one variable simultaneously. A businessman may be keen to know what amount of investment would yield a desired level of profit or a student may want to know whether performing better in the selection test would enhance his or her chance of doing well in the final examination. With a view to answering this series of questions, we need to study more than one variable at the same time. Correlation Analysis and Regression Analysis are the two analyses that are made from a multivariate distribution i.e. a distribution of more than one variable. In particular when there are two variables, say x and y, we study bivariate distribution. We restrict our discussion to bivariate distribution only.
Correlation analysis, it may be noted, helps us to find an association or the lack of it between the two variables x and y. Thus if x and y stand for profit and investment of a firm or the marks in Statistics and Mathematics for a group of students, then we may be interested to know whether x and y are associated or independent of each other. The extent or amount of correlation between x and y is provided by different measures of Correlation namely Product Moment Correlation Coefficient or Rank Correlation Coefficient or Coefficient of Concurrent Deviations. In Correlation analysis, we must be careful about a cause and effect relation between the variables under consideration because there may be situations where x and y are related due to the influence of a third variable although no causal relationship exists between the two variables.
Regression analysis, on the other hand, is concerned with predicting the value of the dependent variable corresponding to a known value of the independent variable on the assumption of a mathematical relationship between the two variables and also an average relationship between them.
18.2 BIVARIATE DATA:- When data are collected on two variables simultaneously, they are known as bivariate data and the corresponding frequency distribution, derived from it, is known as Bivariate Frequency Distribution. If x and y denote marks in Maths and Stats for a group of 30 students, then the corresponding bivariate data would be (xi, yi) for i = 1, 2, …. 30 where (x1, y1) denotes the marks in Mathematics and Statistics for the student with serial number or Roll Number 1, (x2, y2), that for the student with Roll Number 2 and so on and lastly (x30, y30) denotes the pair of marks for the student bearing Roll Number 30.
As in the case of a Univariate Distribution, we need to construct the frequency distribution for bivariate data. Such a distribution takes into account the classification in respect of both the variables simultaneously. Usually, we make horizontal classification in respect of x and vertical classification in respect of the other variable y. Such a distribution is known as Bivariate Frequency Distribution or Joint Frequency Distribution or Two way classification of the two variables x and y.
ILLUSTRATIONS:-
Example 18.1: Prepare a Bivariate Frequency table for the following data relating to the marks in Statistics (x) and Mathematics (y):
Take mutually exclusive classification for both the variables, the first class interval being 0-4 for both.
Solution:
From the given data, we find that
Range for x = 19–1 = 18
Range for y = 19–1 = 18
We take the class intervals 0-4, 4-8, 8-12, 12-16, 16-20 for both the variables. Since the first pair of marks is (15, 13) and 15 belongs to the fourth class interval (12-16) for x and 13 belongs to the fourth class interval for y, we put a stroke in the (4, 4)-th cell. We carry on giving tally marks till the list is exhausted.
We note, from the above table, that some of the cell frequencies (fij) are zero. Starting from the above Bivariate Frequency Distribution, we can obtain two types of univariate distributions which are known as:
(a) Marginal distribution.
(b) Conditional distribution.
If we consider the distribution of Statistics marks along with the marginal totals presented in the last column of Table 12-1, we get the marginal distribution of marks in Statistics. Similarly, we can obtain one more marginal distribution of Mathematics marks. The following table shows the marginal distribution of marks of Statistics.
We can find the mean and standard deviation of marks in Statistics from Table 18.2. They would be known as marginal mean and marginal SD of Statistics marks. Similarly, we can obtain the marginal mean and marginal SD of Mathematics marks. Any other statistical measure in respect of x or y can be computed in a similar manner.
If we want to study the distribution of Statistics Marks for a particular group of students, say for those students who got marks between 8 to 12 in Mathematics, we come across another univariate distribution known as conditional distribution.
We may obtain the mean and SD from the above table. They would be known as conditional mean and conditional SD of marks of Statistics. The same result holds for marks in Mathematics.
In particular, if there are m classifications for x and n classifications for y, then there would be altogether (m + n) conditional distribution.
18.3 CORRELATION ANALYSIS:- While studying two variables at the same time, if it is found that the change in one variable is reciprocated by a corresponding change in the other variable either directly or inversely, then the two variables are known to be associated or correlated. Otherwise, the two variables are known to be dissociated or uncorrelated or independent. There are two types of correlation.
(i) Positive correlation
(ii) Negative correlation
If two variables move in the same direction i.e. an increase (or decrease) on the part of one variable introduces an increase (or decrease) on the part of the other variable, then the two variables are known to be positively correlated. As for example, height and weight yield and rainfall, profit and investment etc. are positively correlated.
On the other hand, if the two variables move in the opposite directions i.e. an increase (or a decrease) on the part of one variable results a decrease (or an increase) on the part of the other variable, then the two variables are known to have a negative correlation. The price and demand of an item, the profits of Insurance Company and the number of claims it has to meet etc. are examples of variables having a negative correlation.
The two variables are known to be uncorrelated if the movement on the part of one variable does not produce any movement of the other variable in a particular direction. As for example, Shoesize and intelligence are uncorrelated.
18.4 MEASURES OF CORRELATION:- We consider the following measures of correlation:
(a) Scatter diagram
(b) Karl Pearson’s Product moment correlation coefficient
(c) Spearman’s rank correlation co-efficient
(d) Co-efficient of concurrent deviations
(a) SCATTER DIAGRAM:- This is a simple diagrammatic method to establish correlation between a pair of variables. Unlike product moment correlation co-efficient, which can measure correlation only when the variables are having a linear relationship, scatter diagram can be applied for any type of correlation – linear as well as non-linear i.e. curvilinear. Scatter diagram can distinguish between different types of correlation although it fails to measure the extent of relationship between the variables.
Each data point, which in this case a pair of values (xi, yi) is represented by a point in the rectangular axes of cordinates. The totality of all the plotted points forms the scatter diagram. The pattern of the plotted points reveals the nature of correlation. In case of a positive correlation, the plotted points lie from lower left corner to upper right corner, in case of a negative correlation the plotted points concentrate from upper left to lower right and in case of zero correlation, the plotted points would be equally distributed without depicting any particular pattern. The following figures show different types of correlation and the one to one correspondence between scatter diagram and product moment correlation coefficient.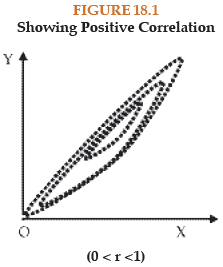


(b) KARL PEARSON’S PRODUCT MOMENT CORRELATION COEFFICIENT:-
This is by for the best method for finding correlation between two variables provided the relationship between the two variables is linear. Pearson’s correlation coefficient may be defined as the ratio of covariance between the two variables to the product of the standard deviations of the two variables. If the two variables are denoted by x and y and if the corresponding bivariate data are (xi, yi) for i = 1, 2, 3, ….., n, then the coefficient of correlation between x and y, due to Karl Pearson, in given by: ...(18.1)
where
A single formula for computing correlation coefficient is given by
In case of a bivariate frequency distribution, we have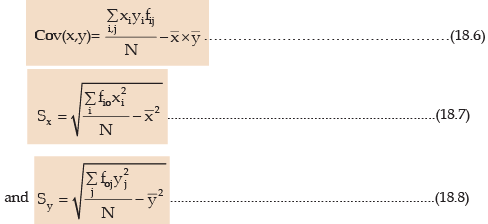
where xi = Mid-value of the ith class interval of x.
PROPERTIES OF CORRELATION COEFFICIENT:-
(i) The Coefficient of Correlation is a unit-free measure.
This means that if x denotes height of a group of students expressed in cm and y denotes their weight expressed in kg, then the correlation coefficient between height and weight would be free from any unit.
(ii) The coefficient of correlation remains invariant under a change of origin and/or scale of the variables under consideration depending on the sign of scale factors.
This property states that if the original pair of variables x and y is changed to a new pair of variables u and v by effecting a change of origin and scale for both x and y i.e.
where a and c are the origins of x and y and b and d are the respective scales and then we have
rxy and ruv being the coefficient of correlation between x and y and u and v respectively, (18.10) established, numerically, the two correlation coefficients remain equal and they would have opposite signs only when b and d, the two scales, differ in sign.
(iii) The coefficient of correlation always lies between –1 and 1, including both the limiting values i.e.
–1 ≤ r ≤ 1 .............................................(18.11)
Example 18.2: Compute the correlation coefficient between x and y from the following data n = 10, ∑xy = 220, ∑x2 = 200, ∑y2 = 262
∑x= 40 and ∑y = 50
Solution:- From the given data, we have by applying (18.5),
Thus there is a good amount of positive correlation between the two variables x and y.
Alternately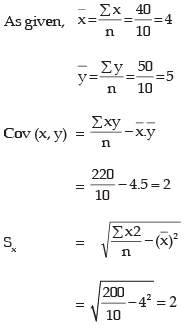

Thus applying formula (18.1), we get
As before, we draw the same conclusion.
Example 18.3: Find product moment correlation coefficient from the following information:
Solution:- In order to find the covariance and the two standard deviation, we prepare the following table:
We have

Thus the correlation coefficient between x and y in given by
We find a high degree of negative correlation between x and y. Also, we could have applied formula (18.5) as we have done for the first problem of computing correlation coefficient.
Sometimes, a change of origin reduces the computational labor to a great extent. This we are going to do in the next problem.
Example 18.4: The following data relate to the test scores obtained by eight salesmen in an aptitude test and their daily sales in thousands of rupees:
Solution:- Let the scores and sales be denoted by x and y respectively. We take a, origin of x as the average of the two extreme values i.e. 54 and 70. Hence a = 62 similarly, the origin of y is taken

Since correlation coefficient remains unchanged due to change of origin, we have

In some cases, there may be some confusion about selecting the pair of variables for which correlation is wanted. This is explained in the following problem.
Example 18.5: Examine whether there is any correlation between age and blindness on the basis of the following data:
Solution:- Let us denote the mid-value of age in years as x and the number of blind persons per lakh as y.
Then as before, we compute correlation coefficient between x and y.
The correlation coefficient between age and blindness is given by
which exhibits a very high degree of positive correlation between age and blindness.
Example 18.6: Coefficient of correlation between x and y for 20 items is 0.4. The AM’s and SD’s of x and y are known to be 12 and 15 and 3 and 4 respectively. Later on, it was found that the pair (20, 15) was wrongly taken as (15, 20). Find the correct value of the correlation coefficient.
Solution:
We are given that n = 20 and the original r = 0.4, 

Hence, corrected 


Thus corrected 
= 20 × 12 – 15 + 20
= 245
Similarly corrected∑y = 20 × 15 - 20 + 15 = 295
Corrected ∑x2 = 3060 - 152 + 202 = 3235
Corrected ∑y2 = 4820 - 202 + 152 = 4645
Thus corrected value of the correlation coefficient by applying formula (18.5)
Example 18.7: Compute the coefficient of correlation between marks in Statistics and Mathematics for the bivariate frequency distribution shown in Table 18.6
Solution: For the sake of computational advantage, we effect a change of origin and scale for both the variable x and y.
Where xi and yj denote respectively the mid-values of the x-class interval and y-class interval respectively. The following table shows the necessary calculation on the right top corner of each cell, the product of the cell frequency, corresponding u value and the respective v value has been shown. They add up in a particular row or column to provide the value of fijuivj for that particular row or column.
A single formula for computing correlation coefficient from bivariate frequency distribution is given by
The value of r shown a good amount of positive correlation between the marks in Statistics and Mathematics on the basis of the given data.
Example 18.8: Given that the correlation coefficient between x and y is 0.8, write down the correlation coefficient between u and v where
(i) 2u + 3x + 4 = 0 and 4v + 16y + 11 = 0
(ii) 2u – 3x + 4 = 0 and 4v + 16y + 11 = 0
(iii) 2u – 3x + 4 = 0 and 4v – 16y + 11 = 0
(iv) 2u + 3x + 4 = 0 and 4v – 16y + 11 = 0
Solution:
Using (18.10), we find that
i.e. rxy = ruv if b and d are of same sign and ruv = –rxy when b and d are of opposite signs, b and d being the scales of x and y respectively. In (i), u = (–2) + (-3/2) x and v = (–11/4) + (–4)y.
Since b = –3/2 and d = –4 are of same sign, the correlation coefficient between u and v would be the same as that between x and y i.e. rxy = 0.8 =ruv
In (ii), u = (–2) + (3/2)x and v = (–11/4) + (–4)y Hence b = 3/2 and d = –4 are of opposite signs and we have ruv = –rxy = –0.8
Proceeding in a similar manner, we have ruv = 0.8 and – 0.8 in (iii) and (iv).
(c) SPEARMAN’S RANK CORRELATION COEFFICIENT:- When we need finding correlation between two qualitative characteristics, say, beauty and intelligence, we take recourse to using rank correlation coefficient. Rank correlation can also be applied to find the level of agreement (or disagreement) between two judges so far as assessing a qualitative characteristic is concerned. As compared to product moment correlation coefficient, rank correlation coefficient is easier to compute, it can also be advocated to get a first hand impression about the correlation between a pair of variables. Spearman’s rank correlation coefficient is given by
where rR denotes rank correlation coefficient and it lies between –1 and 1 inclusive of these two values.
di = xi – yi represents the difference in ranks for the i-th individual and n denotes the number of individuals.
In case u individuals receive the same rank, we describe it as a tied rank of length u. In case of a tied rank, formula (18.11) is changed to
In this formula, tj represents the jth tie length and the summation  extends over the lengths of all the ties for both the series.
Example 18.9: compute the coefficient of rank correlation between sales and advertisement expressed in thousands of rupees from the following data:
Solution:- Let the rank given to sales be denoted by x and rank of advertisement be denoted by y. We note that since the highest sales as given in the data, is 95, it is to be given rank 1, the second highest sales 90 is to be given rank 2 and finally rank 8 goes to the lowest sales, namely 68. We have given rank to the other variable advertisement in a similar manner. Since there are no ties, we apply formula (16.11).

The high positive value of the rank correlation coefficient indicates that there is a very good amount of agreement between sales and advertisement.
Example 18.10: Compute rank correlation from the following data relating to ranks given by two judges in a contest:
Solution:- We directly apply formula (18.11) as ranks are already given.
The rank correlation coefficient is given by
The very low value (almost 0) indicates that there is hardly any agreement between the ranks given by the two Judges in the contest.
Example 18.11: Compute the coefficient of rank correlation between Eco. marks and stats. Marks as given below:
Solution:- This is a case of tied ranks as more than one student share the same mark both for Economics and Statistics. For Eco. the student receiving 80 marks gets rank 1 one getting 62 marks receives rank 2, the student with 60 receives rank 3, student with 56 marks gets rank 4 and since there are two students, each getting 50 marks, each would be receiving a common rank, the average of the next two ranks 5 and 6 i.e. 
7 goes to the student getting the lowest Eco marks. In a similar manner, we award ranks to the students with stats marks.
For Economics mark there is one tie of length 2 and for stats mark, there are two ties of lengths 2 and 3 respectively.
Example 18.12: For a group of 8 students, the sum of squares of differences in ranks for Mathematics and Statistics marks was found to be 50 what is the value of rank correlation coefficient?
Solution: As given n = 8 and  Hence the rank correlation coefficient between marks in Mathematics and Statistics is given by
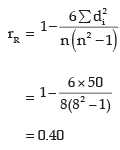
Example 18.13: For a number of towns, the coefficient of rank correlation between the people living below the poverty line and increase of population is 0.50. If the sum of squares of the differences in ranks awarded to these factors is 82.50, find the number of towns.
Solution:


Example 18.14: While computing rank correlation coefficient between profits and investment for 10 years of a firm, the difference in rank for a year was taken as 7 instead of 5 by mistake and the value of rank correlation coefficient was computed as 0.80. What would be the correct value of rank correlation coefficient after rectifying the mistake?
Solution: We are given that n = 10,
rR = 0.80 and the wrong di = 7 should be replaced by 5.
Corrected ∑d2i = 33 - 72 + 52 = 9
Hence rectified value of rank correlation coefficient
(d) COEFFICIENT OF CONCURRENT DEVIATIONS:- A very simple and casual method of finding correlation when we are not serious about the magnitude of the two variables is the application of concurrent deviations. This method involves in attaching a positive sign for a x-value (except the first) if this value is more than the previous value and assigning a negative value if this value is less than the previous value. This is done for the y-series as well. The deviation in the x-value and the corresponding y-value is known to be concurrent if both the deviations have the same sign.
Denoting the number of concurrent deviation by c and total number of deviations as m (which must be one less than the number of pairs of x and y values), the coefficient of concurrent deviation is given by
If (2c–m) >0, then we take the positive sign both inside and outside the radical sign and if (2c–m) <0, we are to consider the negative sign both inside and outside the radical sign.
Like Pearson’s correlation coefficient and Spearman’s rank correlation coefficient, the coefficient of concurrent deviations also lies between –1 and 1, both inclusive.
Example 18.15: Find the coefficient of concurrent deviations from the following data.
Solution:
In this case, m = number of pairs of deviations = 7
c = No. of positive signs in the product of deviation column = Number of concurrent deviations = 2

(Since  we take negative sign both inside and outside of the radical sign)Thus there is a negative correlation between price and demand.
18.5 REGRESSION ANALYSIS:- In regression analysis, we are concerned with the estimation of one variable for a given value of another variable (or for a given set of values of a number of variables) on the basis of an average mathematical relationship between the two variables (or a number of variables). Regression analysis plays a very important role in the field of every human activity. A businessman may be keen to know what would be his estimated profit for a given level of investment on the basis of the past records. Similarly, an outgoing student may like to know her chance of getting a first class in the final University Examination on the basis of her performance in the college selection test.
When there are two variables x and y and if y is influenced by x i.e. if y depends on x, then we get a simple linear regression or simple regression. y is known as dependent variable or regression or explained variable and x is known as independent variable or predictor or explanator. In the previous examples since profit depends on investment or performance in the University Examination is dependent on the performance in the college selection test, profit or performance in the University Examination is the dependent variable and investment or performance in the selection test is the In-dependent variable.
In case of a simple regression model if y depends on x, then the regression line of y on x in given by
y = a + bx …………………… (18.14)
Here a and b are two constants and they are also known as regression parameters. Furthermore, b is also known as the regression coefficient of y on x and is also denoted by byx. We may define the regression line of y on x as the line of best fit obtained by the method of least squares and used for estimating the value of the dependent variable y for a known value of the independent variable x.
The method of least squares involves in minimizing
where yi demotes the actual or observed value and y^i = a + bxi, the estimated value of yi for a given value of xi, ei is the difference between the observed value and the estimated value and ei is technically known as error or residue. This summation intends over n pairs of observations of (xi, yi). The line of regression of y or x and the errors of estimation are shown in the following figure.
SHOWING REGRESSION LINE OF y on x AND ERRORS OF ESTIMATION
Minimisation of (18.15) yields the following equations known as ‘Normal Equations’
Solving there two equations for b and a, we have the “least squares” estimates of b and a as

After estimating b, estimate of a is given by
Substituting the estimates of b and a in (18.14), we get
There may be cases when the variable x depends on y and we may take the regression line of x on y as
x = a^+ b^y
Unlike the minimization of vertical distances in the scatter diagram as shown in figure (18.7) for obtaining the estimates of a and b, in this case we minimize the horizontal distances and get the following normal equation in a^ and b^, the two regression parameters :
A single formula for estimating b is given by

The standardized form of the regression equation of x on y, as in (18.20), is given by
Example 16.15: Find the two regression equations from the following data:
Hence estimate y when x is 13 and estimate also x when y is 15.
Solution:-
On the basis of the above table, we have
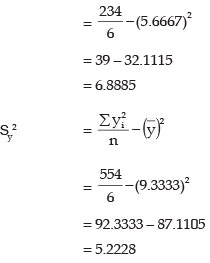
The regression line of y on x is given by
y = a + bx
Thus the estimated regression equation of y on x is
y = 4.7178 + 0.8145x
When x = 13, the estimated value of y is given by yˆ = 4.7178 + 0.8145 × 13 = 15.3063
The regression line of x on y is given by

Thus the estimated regression line of x on y is
x = –4.3601 + 1.0743y
When y = 15, the estimate value of x is given by
xˆ = – 4.3601 + 1.0743 × 15
= 11.75
Example 18.16: Marks of 8 students in Mathematics and statistics are given as:
Find the regression lines. When marks of a student in Mathematics are 90, what are his most likely marks in statistics?
Solution: We denote the marks in Mathematics and Statistics by x and y respectively. We are to find the regression equation of y on x and also of x or y. Lastly, we are to estimate y when x = 90. For computation advantage, we shift origins of both x and y.
The regression coefficients b (or byx) and b’ (or bxy) remain unchanged due to a shift of origin.
Applying (18.25) and (18.26), we get


The regression line of y on x is
y = –10.4571 + 1.1406x
and the regression line of x on y is
x = 36.2281 + 0.5129y
For x = 90, the most likely value of y is = –10.4571 + 1.1406 x 90
= 92.1969
≅ 92
Example 18.17: The following data relate to the mean and SD of the prices of two shares in a stock Exchange:
Coefficient of correlation between the share prices = 0.48
Find the most likely price of share A corresponding to a price of ₹60 of share B and also the most likely price of share B for a price of ₹50 of share A.
Solution: Denoting the share prices of Company A and B respectively by x and y, we are given that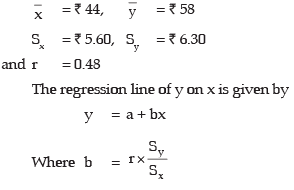

Thus the regression line of y on x i.e. the regression line of price of share B on that of share A is given by
y= ₹(34.24 + 0.54x)
When x = ₹50, = ₹(34.24 + 0.54 × 50)
= ₹61.24
= The estimated price of share B for a price of ₹ 50 of share A is ₹61.24
Again the regression line of x on y is given by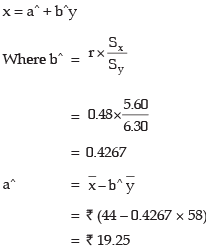
Hence the regression line of x on y i.e. the regression line of price of share A on that of share B in given by

Example 18.18: The following data relate the expenditure or advertisement in thousands of rupees and the corresponding sales in lakhs of rupees.
Find an appropriate regression equation.
Solution: Since sales (y) depend on advertisement (x), the appropriate regression equation is of y on x i.e. of sales on advertisement. We have, on the basis of the given data,


Thus, the regression line of y or x i.e. the regression line of sales on advertisement is given by
y = 6.4927 + 1.4643x
18.6 PROPERTIES OF REGRESSION LINES:- We consider the following important properties of regression lines:
(i) The regression coefficients remain unchanged due to a shift of origin but change due to a shift of scale.
This property states that if the original pair of variables is (x, y) and if they are changed to the pair (u, v) where
ii) The two lines of regression intersect at the point  , where x and y are the variables under consideration.
According to this property, the point of intersection of the regression line of y on x and the regression line of x on y is ) i.e. the solution of the simultaneous equations in x and y.
(iii) The coefficient of correlation between two variables x and y in the simple geometric mean of the two regression coefficients. The sign of the correlation coefficient would be the common sign of the two regression coefficients.
This property says that if the two regression coefficients are denoted by byx (=b) and bxy (=b’) then the coefficient of correlation is given by
If both the regression coefficients are negative, r would be negative and if both are positive, r would assume a positive value.
Example 18.19: If the relationship between two variables x and u is u + 3x = 10 and between two other variables y and v is 2y + 5v = 25, and the regression coefficient of y on x is known as 0.80, what would be the regression coefficient of v on u?
Solution: u + 3x = 10
From (16.28), we have
Example 18.20: For the variables x and y, the regression equations are given as 7x – 3y – 18 = 0 and 4x – y – 11 = 0
(i) Find the arithmetic means of x and y.
(ii) Identify the regression equation of y on x.
(iii) Compute the correlation coefficient between x and y.
(iv) Given the variance of x is 9, find the SD of y.
Solution: (i) Since the two lines of regression intersect at the point , replacing x and y by
  respectively in the given regression equations, we get
Solving these two equations, we get 
Thus the arithmetic means of x and y are given by 3 and 1 respectively.
(ii) Let us assume that 7x – 3y – 18 = 0 represents the regression line of y on x and 4x – y – 11 = 0 represents the regression line of x on y.
Now 7x – 3y – 18 = 0
Since  , our assumptions are correct. Thus, 7x - 3y - 18 = 0 truly represents the regression line of y on x.
∴ r=  (We take the sign of r as positive since both the regression coefficients are positive)
= 0.7638
18.7 PROBABLE ERROR:- The correlation coefficient calculated from the sample of n pairs of value from large population.
It is possible to determine the limits of the correlation coefficient of population and which coefficient of correlation of correlation of the population will lie from the knowledge of sample correlation coefficient.
Probable Error is a method of obtaining correlation coefficient of population. It is defined as:
Where r = Correlation coefficient fromn pairs of sample observations
PE = 2/3 SE
When SE = Standard Error of correlation coefficient
The limit of the correlation coefficient is given by p = r ± P.E
Where p = Correlation coefficient of the population
The following are the assumption while probable Errors are significant.
(i) If r< PE there is no evidence of correlation
(ii) If the value of ‘r ‘is more than 6 times of the probable error, then the presence of correlation coefficient is certain
(iii) Since ‘r ‘lies between -1 and +1 (-1 ≤ r ≤ 1) the probable error is never negative.
Note: The formula PE is valued only if
(1) The sample chooses to find ‘r’is a sample random sample (2) the population is normal.
Example 18.21: Compute the Probable Error assuming the correlation coefficient of 0.8 from a sample of 25 pairs of items.
Solution: r = 0.8 ,n = 25
P.E. = 0.6745 ×
= 0.6745 × 0.07 = 0.0486
Example 18.22: If r = 0.7 ; and n = 64 find out the probable error of the coefficient of correlation and determine the limits for the population correlation coefficient:
Solution: r = 0.7 ; n= 64
Probable Error (P.E.) = 
= (0.6745) × (0.06375)
= 0.043
Limits for the population correlation coefficient
(0.7 ± 0.043)
i.e. (0.743, 0.657)
18.8 REVIEW OF CORRELATION AND REGRESSION ANALYSIS:-
So far we have discussed the different measures of correlation and also how to fit regression lines applying the method of ‘Least Squares’. It is obvious that we take recourse to correlation analysis when we are keen to know whether two variables under study are associated or correlated and if correlated, what is the strength of correlation. The best measure of correlation is provided by Pearson’s correlation coefficient. However, one severe limitation of this correlation coefficient, as we have already discussed, is that it is applicable only in case of a linear relationship between the two variables.
If two variables x and y are independent or uncorrelated then obviously the correlation coefficient between x and y is zero. However, the converse of this statement is not necessarily true i.e. if the correlation coefficient, due to Pearson, between two variables comes out to be zero, then we cannot conclude that the two variables are independent. All that we can conclude is that no linear relationship exists between the two variables. This, however, does not rule out the existence of some non linear relationship between the two variables. For example, if we consider the following pairs of values on two variables x and y.
(–2, 4), (–1, 1), (0, 0), (1, 1) and (2, 4), then cov (x, y) = (–2+ 4) + (–1+1) + (0×0) + (1×1) + (2×4) = 0
Thus rxy = 0
This does not mean that x and y are independent. In fact the relationship between x and y is y = x2. Thus it is always wiser to draw a scatter diagram before reaching conclusion about the existence of correlation between a pair of variables.
There are some cases when we may find a correlation between two variables although the two variables are not causally related. This is due to the existence of a third variable which is related to both the variables under consideration. Such a correlation is known as spurious correlation or non-sense correlation. As an example, there could be a positive correlation between production of rice and that of iron in India for the last twenty years due to the effect of a third variable time on both these variables. It is necessary to eliminate the influence of the third variable before computing correlation between the two original variables.
Correlation coefficient measuring a linear relationship between the two variables indicates the amount of variation of one variable accounted for by the other variable. A better measure for this purpose is provided by the square of the correlation coefficient, Known as ‘coefficient of determination’. This can be interpreted as the ratio between the explained variance to total variance i.e.
Thus a value of 0.6 for r indicates that (0.6)2 × 100% or 36 per cent of the variation has been accounted for by the factor under consideration and the remaining 64 per cent variation is due to other factors. The ‘coefficient of non-determination’ is given by (1–r2) and can be interpreted as the ratio of unexplained variance to the total variance.
Coefficient of non-determination = (1–r2)
Regression analysis, as we have already seen, is concerned with establishing a functional relationship between two variables and using this relationship for making future projection. This can be applied, unlike correlation for any type of relationship linear as well as curvilinear. The two lines of regression coincide i.e. become identical when r = –1 or 1 or in other words, there is a perfect negative or positive correlation between the two variables under discussion. If r = 0 Regression lines are perpendicular to each other.
FAQs on ICAI Notes: Correlation And Regression- 1 - CA Foundation
| 1. What is correlation analysis? |  |
| 2. How is correlation coefficient calculated? |  |
| 3. What is regression analysis? |  |
| 4. How is the regression equation determined? |  |
| 5. What is the difference between correlation and regression? |  |

|
Explore Courses for CA Foundation exam
|

|


