Data Handling Class 6 Worksheet Maths Chapter 4

Q1: The pictograph shows how many snowballs each child made. Use the pictograph to answer the given questions.
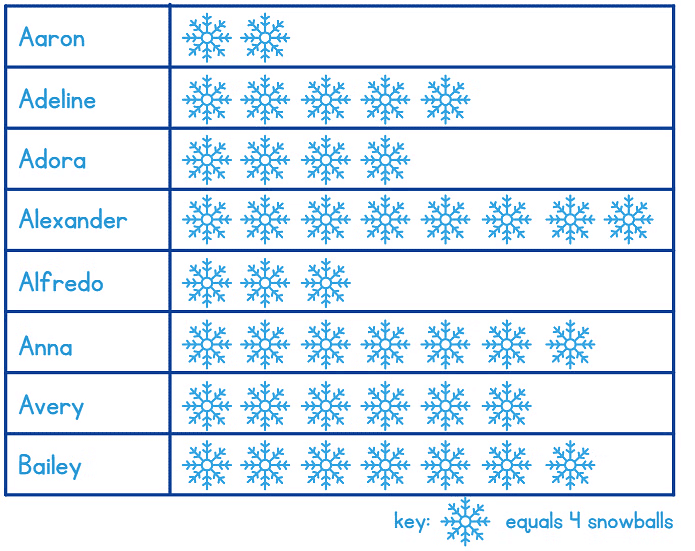
(i) How many snowballs did Alfredo make?
(ii) How many snowballs did Aaron make?
(iii) Name two people who made the same number of snowballs.
(iv) How many more snowballs did Bailey make than Adeline?
(v) How many more snowballs did Alexander make than Adora?
Q2: Following are the marks obtained by 72 students in Geography. Arrange these marks in a table using tally marks.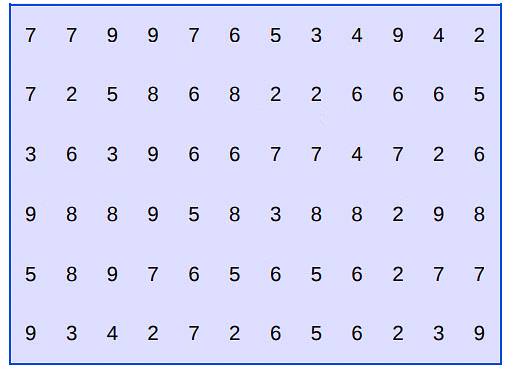
(a) students obtained more than 6 marks.
(b) students obtained marks equal to or below 2.
Q3: Reena collected the data for the ages (in years) of her hobby class group and she recorded the findings in the manner shown below :
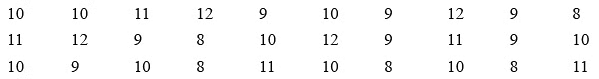
Represent the above data using tally marks in the table below :
| Ages (in years) | Tally Marks | Frequency |
| 8 |  | 05 |
| 9 | ||
| 10 | ||
| 11 | ||
| 12 |
(i) Find the age that appeared maximum number of times?
(ii) Find the ages that appeared equal number of times.
(iii) How many children are below 11 years?
(iv) How many children are of 10 years or above?
Q4: Following is the pictograph of class VI students. Here 1  = 10 boys and 1
  = 10 girls. Looking at the pictograph below, answer the following questions.
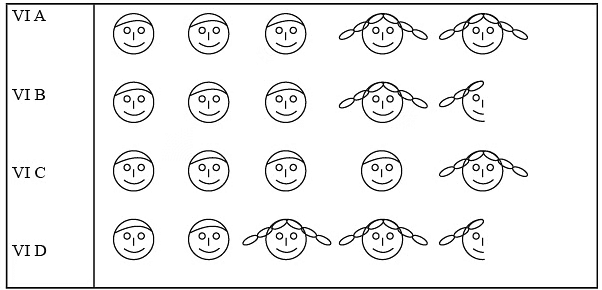
(i) How many students are there in VI A, VI B, VI C and VI D sections each? __________
(ii) Which section has maximum number of boys? __________
(iii) Which section has maximum number of girls? __________
(iv) What is the total strength of class VI? __________
Q5: The number of students present in class VI during a particular week is given below. It is represented by a pictograph where 1  = 6 students.
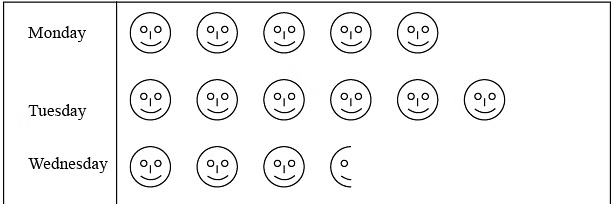
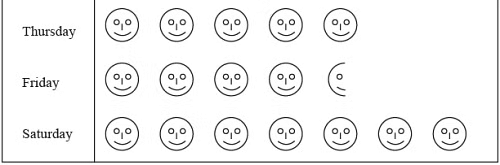
(i) On which day maximum students were present? __________
(ii) On which day minimum students were present? __________
(iii) How many students were present on Wednesday and Thursday each? __________
Q6: A survey showed the preference of different subjects by students of class VI
| Subject | No. of Students |
| English | 25 |
| Hindi | 30 |
| Maths | 50 |
| Science | 35 |
| Social Science | 40 |
Draw a pictograph to illustrate the above data taking a scale of 1 students.
Q7: The tally chart shows the items sold during the weekends. Use the information from the tally chart to answer the questions.
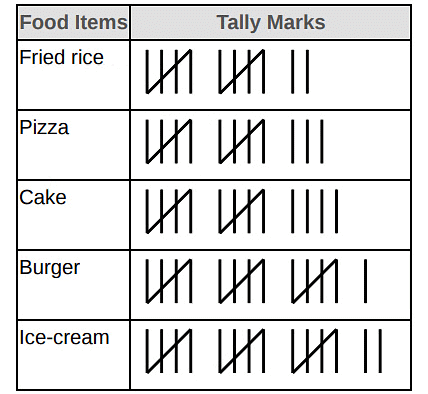
Find the following:
(a) The sale of is maximum.
(b) Fried rice were sold in all.
Q8: The following pictograph shows the number of pears in 6 bags
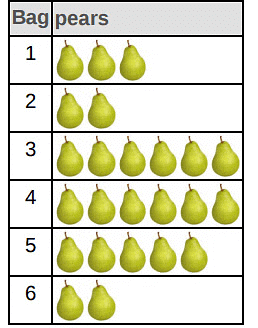 Find the following.
(a) Bag with the maximum number of pears.
(b) Bag with the minimum number of pears.
(c) Total number of pears in all the bags.
You can access the solutions to this worksheet here.
FAQs on Data Handling Class 6 Worksheet Maths Chapter 4
| 1. What is data handling in mathematics? |  |
| 2. Why is data handling important for Class 6 students? | |
| 3. What are some common methods of presenting data? | |
| 4. How can we collect data effectively for a project? | |
| 5. What are the steps involved in the data handling process? | |


shortcuts and tricks
,Semester Notes
,Data Handling Class 6 Worksheet Maths Chapter 4
,past year papers
,practice quizzes
,Important questions
,Summary
,study material
,Free
,mock tests for examination
,Previous Year Questions with Solutions
,ppt
,Extra Questions
,Viva Questions
,video lectures
,MCQs
,Data Handling Class 6 Worksheet Maths Chapter 4
,Data Handling Class 6 Worksheet Maths Chapter 4
,Objective type Questions
,Sample Paper
,Exam
;


Worksheet: Data Handling Free PDF Download
Importance of Worksheet: Data Handling
Worksheet: Data Handling Notes
Worksheet: Data Handling Class 6 Questions
Study Worksheet: Data Handling on the App
|
© EduRev
|
Education Revolution
|


|


