Data Handling Class 8 Notes Maths Chapter 4
| Table of contents |
|
| Introduction |
|
| Looking for Information |
|
| Circle Graph or Pie Chart |
|
| Chance and Probability |
|

Introduction
What is Data?
Data is a collection of facts, such as numbers, words, measurements, observations or even just descriptions of things.
The word data means the collection of information in the form of numerical figures or a set of given facts. Data is a collection of numbers gathered to give some information.
For example:
- Runs made by Virat Kohli in the last 25 one day (ODIs) matches.
- The number of wickets taken by Jasprit Bumrah in the last 20 T-20 matches.
- Marks obtained by the Rohan in English unit test.
Looking for Information
Data is usually collected based on a particular situation we want to understand. For example, if someone wants to know the average number of books read by students each month, they would first write down how many books each student reads, then organize this information, and finally figure out the average number of books read. Data can be represented graphically as follows:
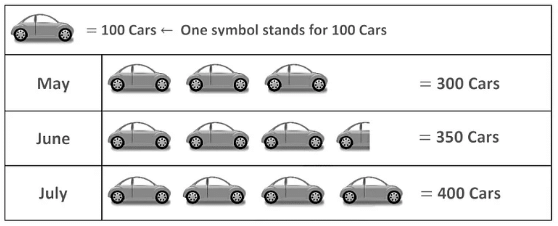
1. A Pictograph
It represents data through appropriate pictures. Generally, the same type of symbols or pictures is used to represent data. Each picture and symbols are used to represent a certain value and it is clearly mentioned in the graph.
The given pictograph represents the number of cars produced in May, June, and July.
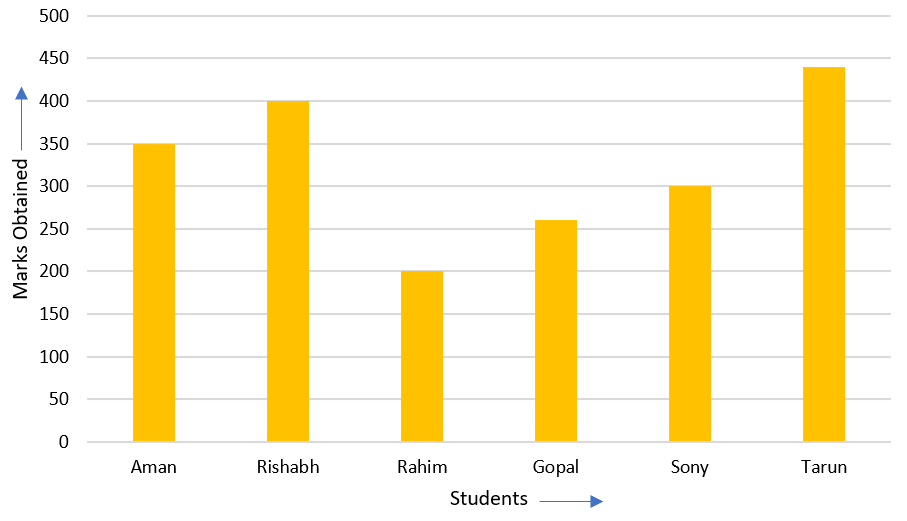
2. A Bar Graph
A display of information using bars of uniform widths, their heights being proportional to the respective values.
For example:
Following data gives total marks (out of 500) obtained by six children of a particular class. Represent the data on a bar graph.
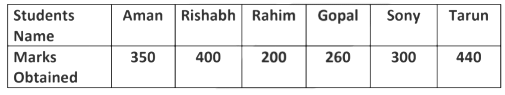
To choose an appropriate scale we make equal divisions taking increments of 100. Thus 1 unit will represent 100 marks. Now represent the data on the bar graph.
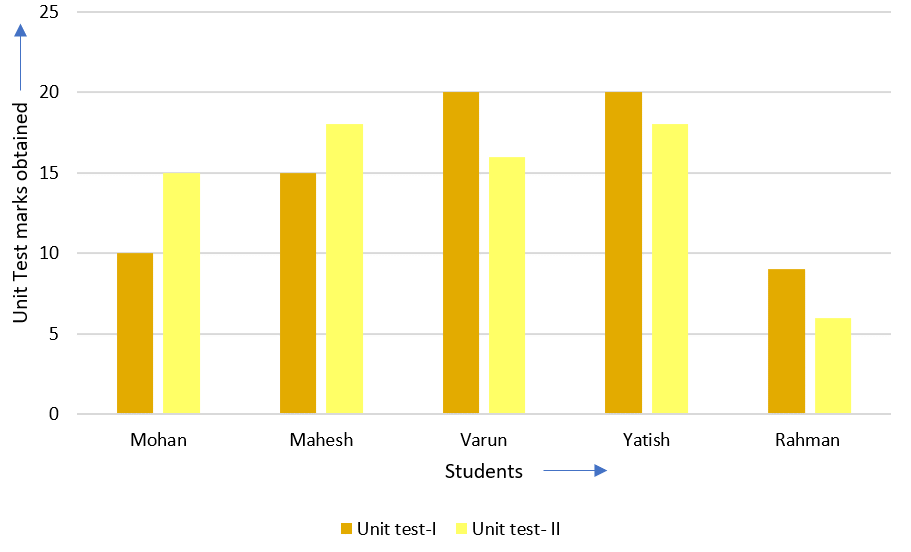
3. Double Bar Graph
A bar graph showing two sets of data simultaneously. It is useful for the comparison of the data.
For example:
A class teacher prepared a report card of unit test-I (out of 20) and unit test-II (out of 20) of 5 students.
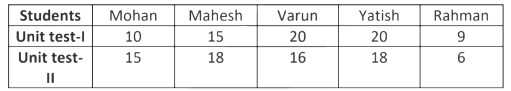 She displayed the information in the double bar graph in the parent-teacher meeting to visualize the performance of the students.
Circle Graph or Pie Chart
What is Circle Graph or Pie Chart?
A circle graph or pie chart shows the relationship between a whole and its parts. The whole circle divided into sectors. The size of each sector is proportional to the activity or information it represents.
The pie chart below shows the time spent by a child in a day.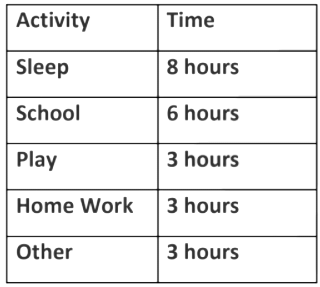
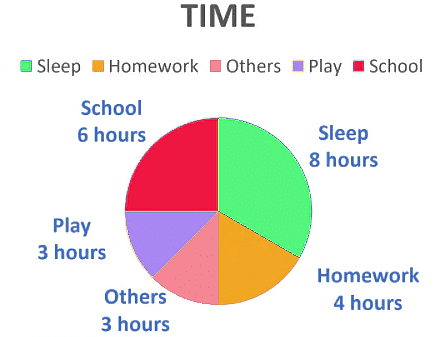
In the above graph, the proportion of the sector for hours spent in sleeping.
= = =
So, this sector is drawn as 1/3rd part of the circle. Similarly, the proportion of the sector for hours spent in School
= = =
So, this sector is drawn as 1/4th part of the circle. Similarly, the size of other sectors can be found.
Drawing Pie Chart
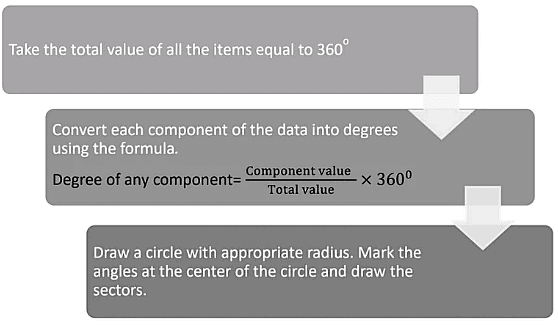
For example,
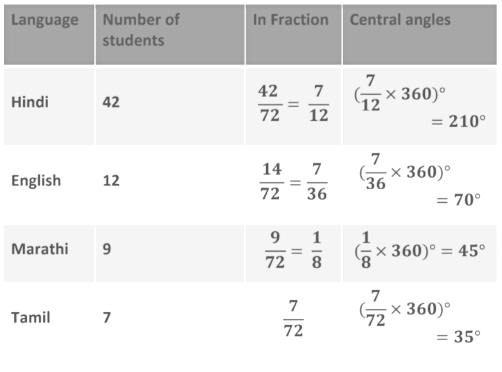
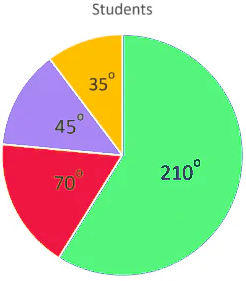
The number of students in a hostel speaking different languages is given below. Present the data in a pie chart.
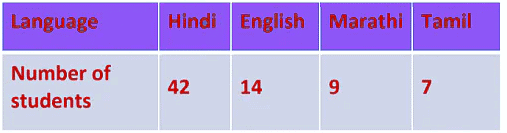
The central angle of the component = x 360°
Chance and Probability
Chance
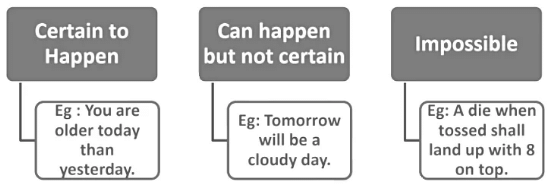
There are scenarios in ourlife, that are certain to happen, while some that are impossible to happen and some that may or may not happen. The situation that may or may not happen has a chance of happening.
The Chance of happening of an event may be described as one of the following:
Getting a Result
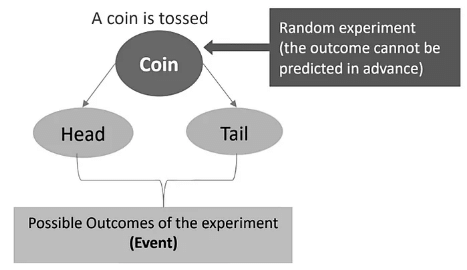
A random experiment is a trial in which the result cannot be predicted in advance. For example, in throwing two coins the possible outcomes are {HH, TT, HT, TH}.
Example: When a die is thrown, what are the six possible outcomes?
Sol. The possible outcomes are 1, 2, 3, 4, 5 and 6.
Equally Likely Outcomes
- Outcomes of an experiment are equally likely if each has the same chance of occurring.
- On throwing a die: 1, 2, 3, 4, 5, 6 are equally likely outcomes.
Example: A coin is tossed multiple times, and each time, we record whether it lands on heads or tails. Let’s examine the result sheet as we continue to increase the number of tosses:
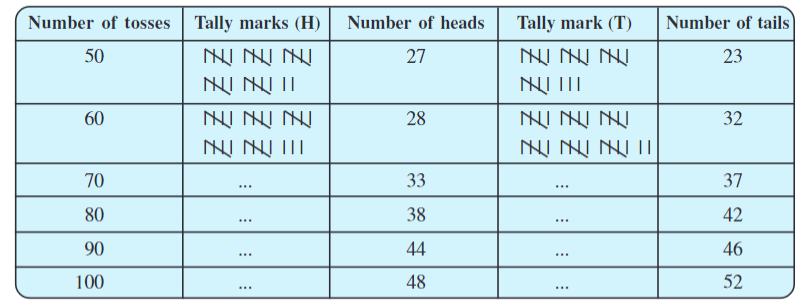
Notice that as the number of tosses increases, the counts of heads and tails get closer and closer to each other. In other words, there is an equal chance of getting either a heads or a tails.
Linking Chances to Probability
- The chance of happening of an event is called the probability of the event happening.
- Probability tells us how likely an event is going to occur.
- It does not tell us what is going to happen.
- We often make predictions about the chances of an event happening.
- There is an even chance of an event happening if the chance of an event happening is the same as the chance of the event not happening.
Example: Numbers 1 to 12 are written on twelve separate slips (one number on one slip), kept in a box and mixed well. One slip is chosen from the box without looking into it. What is the probability of:
(i) getting a number 7?
(ii) getting a number less than 7?
(iii) getting a number greater than 7?
(iv) getting an even number?
Sol: Total number of slips = 12
(i) Probability of getting a number 7:
There is only one slip with the number 7.
So, the probability = 1/12
(ii) Probability of getting a number less than 7:
The numbers less than 7 are 1, 2, 3, 4, 5, and 6, which makes 6 numbers.
So, the probability = 6/12 = 1/2
(iii) Probability of getting a number greater than 7:
The numbers greater than 7 are 8, 9, 10, 11, and 12, which makes 5 numbers.
So, the probability = 5/12
(iv) Probability of getting an even number:
The even numbers between 1 and 12 are 2, 4, 6, 8, 10, and 12, which makes 6 numbers.
So, the probability = 6/12 = 1/2
Outcomes as Events
- Each result of an experiment or a group of results constitutes an event.
- For instance, in a coin toss experiment, getting a Head is one event, and getting a Tail is another event.
Probability is nothing but the numerical value of the possibility of occurrence of an event. The value of probability lies between 0 and 1.
For example,
(a) If we toss a coin, then either head will come up or the tail will come up. Thus, there is an even chance of getting a head when a coin is tossed.
We say that the probability of getting Head or Tail is equal and is 1/2 for each.
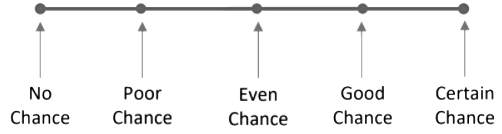
(b) If we throw a ball upward, then it will certainly return to the earth. Thus, the chance of happening an event can be shown on a scale with no chance at one end and certain at other ends.
Thus, the scale is given, below:
Chance and probability related to real life
- Suppose you have a box of 10 chocolates: 3 milk chocolates, 4 dark chocolates, and 3 white chocolates.
- If you randomly pick a chocolate from the box, the chance of picking a milk chocolate is 3/10.
- The probability of picking a dark chocolate is 4/10, which simplifies to 2/5, and the chance of picking a white chocolate is 3/10.
- This example helps illustrate how probability works when choosing from different options.
Example: You have a spinning wheel divided into 4 yellow sectors, 2 blue sectors, and 1 orange sector. What is the probability of:
(i) getting a yellow sector?
(ii) getting a non-blue sector?
Sol: Total number of sectors = 4 (yellow) + 2 (blue) + 1 (orange) = 7
(i) Probability of getting a yellow sector:
There are 4 yellow sectors.
So, the probability = 4/7
(ii) Probability of getting a non-blue sector:
The total number of non-blue sectors is the sum of the yellow and orange sectors, which is 4 (yellow) + 1 (orange) = 5 sectors.
So, the probability = 5/7
|
81 videos|452 docs|31 tests
|
FAQs on Data Handling Class 8 Notes Maths Chapter 4
| 1. What is a circle graph or pie chart, and how is it used in data handling? |  |
| 2. How do you calculate the probability of an event occurring? | |
| 3. What are the main differences between a circle graph and a bar graph? | |
| 4. How can I interpret the data presented in a pie chart? | |
| 5. What are some common mistakes to avoid when creating pie charts? | |


Viva Questions
,Semester Notes
,mock tests for examination
,MCQs
,Objective type Questions
,Important questions
,Sample Paper
,practice quizzes
,Data Handling Class 8 Notes Maths Chapter 4
,Extra Questions
,Previous Year Questions with Solutions
,study material
,ppt
,Summary
,Data Handling Class 8 Notes Maths Chapter 4
,shortcuts and tricks
,Data Handling Class 8 Notes Maths Chapter 4
,video lectures
,Exam
,Free
,past year papers
;


Chapter Notes: Data Handling Free PDF Download
Importance of Chapter Notes: Data Handling
Chapter Notes: Data Handling
Chapter Notes: Data Handling Class 8 Questions
Study Chapter Notes: Data Handling on the App
|
© EduRev
|
Education Revolution
|


|


