Demographic Attributes | Geography Optional for UPSC (Notes) PDF Download
| 1 Crore+ students have signed up on EduRev. Have you? Download the App |
- The Demographic Attributes of a population are basically the inherent components of a population.
- Demography attributes help in forming policies about public health, policies, maintaining law and order, economic policies, taxation, revenue.
- The population is a resource but the resource characteristics depend on the attributes of the population.
- There are two types of demographic attributes:
- Formal Demography or quantitative data such as sex ratio, literacy ratio
- Social Demography; qualitative or socio, economic, the political aspect of data such women participation in politics, etc.

Age structure and life expectancy
- Age structure refers to the study of the proportion of the population in different age groups
- It helps in predicting the future growth rates of the population.
- Age structure and life expectancy are important indicators of the resource quality of the population
- Age structure is generally presented through a pyramid diagram. An ideal pyramid is that in which:
- 0-14 age group must comprise of 25-30% 0f population
- The population with more than 65 years of age must be less than 10%
- The age group between 15-65 years must comprise 60% of the population.
- This indicates young working group population is in large number. But presently the age structure is highly imbalanced in both developed and developing countries.
- In India for example, the high Birth Rate of the past is responsible for a very large proportion of the population in the adult age group which today contributed more than 60% to India’s growth.
- Age structure is also an insight into future economic growth prospects.
- The adult age group makes up the working population and economically productive population whereas the ageing and child population are considered as dependent.

Population pyramid
- Population pyramid is also called the age pyramid. It is a graphical illustration that shows the proportion of the population in different age groups.
- They are the most effective way to graphically depict the age and sex distribution of population parties because of the very clear image these pyramids presents.
- Types of population pyramid can be studied in terms of 4 stages of Demographic Transition Theories
Pyramid for Primitive Demographic Profile
- It is the stage of high fluctuation where high Birth Rate and high Death Rate because of epidemics, famine, primitive, tradition and agrarian society with a focus on primary agriculture (just like Rostov stage I)
- Here the population pyramid would have a broad base and tapering top.

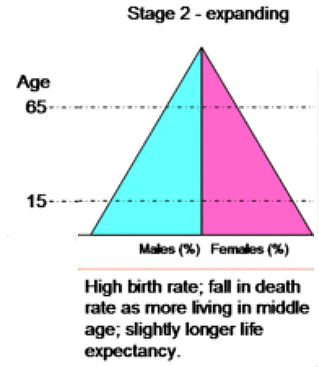
Early expansion stage
- Here the base of the pyramid is large, but height improves because of decrease in Death Rate (longevity improves)
- In Europe, the Early Expanding stage started with the Industrial revolution with better food production and decreasing famines.
- Thus, the Birth rate continued to increase and the mortality rate decreased which improved the high of the population pyramid.

Note: Both pyramids (Primitive Demographic and Early Expanding stage) are regressive population pyramids as these are rapidly tapering towards higher age groups.
Barred shape pyramid
- It corresponds to the late expanding stage of Demographic Transition Theory where the death rate decreases further and almost bottomed out and the birth rate also falls because of social development (education, way of life, small families)
- In the barred-shaped pyramid, there is a bulge in the middle age group.
- A large number of adolescents enter the workforce.
- In general, youth bulges in developing nations are associated with higher unemployment.

Inverted Pyramid
- It corresponds to the stage of populating stabilization of Demographic Transition Theory.
- Birth Rate here falls down and matches the low death rate.
- It is characterized by a higher level of urbanization, industrialization and society move towards the tertiary sector.


Significance of Age pyramid
- Population pyramids can be used to find the number of economic dependents supported in a particular population.
- Economic dependents are those below 15 and above 65 years of age.
- Population pyramids can be further used to calculate the dependency ratio.
- Age structure helps in human resource planning as it produces information about available human resources.
- Thus age structure forms an important component of population analysis. It is required for age-specific analysis of data for planning, scientific, technical, and commercial purposes.
Life expectancy/longevity
Life expectancy can be defined as the average number of years to be lived. It is generally derived from life table calculations either from birth or from particular age.
There are various socio-economic-political factors that affect longevity. Some of them are:
Gender: Biologically female lives for more number of years, but due to social factors like early marriage, female infanticide, high Maternal Mortality Rate, lack of institutional facilities and malnutrition, the life expectancy of females have been decreased.
Access to health care: Good and advanced health care facilities are more easily available to rich and well off people whereas the poor don’t have these facilities easily available to them which decrease their life expectancy.
Hygiene, diet, nutrition, and exercise: Participation in healthier lifestyle habits like exercising more, smoking less, maintaining a healthy weight, taking a healthy diet and maintaining hygiene also increase life expectancy.
Lifestyle: Lifestyle factors that affect mortality include an unhealthy diet, inadequate exercise, tobacco, excessive use of alcohol, risky behaviours, food safety, workplace safety and motor vehicle safety.
Crime rate: Higher crime rate also tends to decrease the life expectancy of the people living in a particular society
Political instability (Conflicts, War): The war torn zones generally witness lower life expectancy rate than politically stable areas. E.g. Syria.
Genetics: There appears to be a link between genetic factors and mortality rates. Genetics may play a role in major causes of death due to disease such as Heart disease, Cancer, Chronic lower respiratory disease, stroke, Alzheimer’s disease, diabetes etc.
Literacy rate
- Proportional of the population which is literate able to read write, understand in any language is called literacy rate.
- The literacy rate is an indication of socio-economic development and standard of living.
- Economic development is the cause and consequence of literacy.
- It increases the participation in cultural and economic well being
- Literate parent are more conscience about children well being.
- The female literacy rate is rising very fast.
Crude Birth Rate( CBR)
Crude Birth rate means the number of live birth per 1000 population.
Crude Death rate
Crude death rate refers to death per thousand population.
Total Fertility rate ( TFR)
The total fertility rate refers to the average women’s child.
2.1 total fertility rate is considered as replace level.
Sex Ratio
Sex ratio = the number of women per 1000 men.
Sex ratio is unfavorable where gender discrimination happens in the form of:
Female Foeticide
Female Infanticides
Domestic violence against women
Fecundity
- As age structure suggests, some individuals within a population have a greater impact on population-level processes, such as growth.
- Fecundity describes the number of offspring an individual or a population is able to produce during a given period of time.
- In demographic studies, fecundity is calculated in age-specific birth rates, which may be expressed as the number of births per unit of time, the number of births per female per unit of time, or the number of births per 1,000 individuals per unit of time.
Morbidity
- The morbidity rate measures the portion of people in a specific geographical location who contracted a particular disease during a specific period of time.
- It indicates the frequency of the disease appearing in a population. Morbidity refers to the status of being ill or unhealthy.
- It includes the conditions of injury, disease, and disability. The disease can either be acute (such as a heart attack) or chronic (such as cancer).
Literacy Rate
- Proportional of the population which is literate able to read write, understand in any language is called literacy rate.
- The literacy rate is an indication of socio-economic development and standard of living.
- Economic development is the cause and consequence of literacy.
- It increases the participation in cultural and economic well being
- Literate parent are more conscience about children well being
- The female literacy rate is rising very fast.
The following are data:

|
191 videos|373 docs|118 tests
|
FAQs on Demographic Attributes - Geography Optional for UPSC (Notes)
| 1. What is the significance of demographic attributes in the UPSC exam? |  |
| 2. What are some examples of demographic attributes that are relevant for the UPSC exam? |  |
| 3. How does the UPSC exam test the knowledge of demographic attributes? |  |
| 4. Can you provide an example of how demographic attributes influence governance and policymaking? |  |
| 5. How can aspirants prepare for the demographic attributes section of the UPSC exam? |  |
|
191 videos|373 docs|118 tests
|

|
Explore Courses for UPSC exam
|

|


