Dispersion - Deviation and Variance to Statistics | Additional Topics for IIT JAM Mathematics PDF Download
Dispersion Deviation and Variance:- Dispersion measures how the various elements behave with regards to some sort of central tendency, usually the mean. Measures of dispersion include range, interquartile range, variance, standard deviation and absolute deviation. We've already looked at the first two in the Averages section, so let's move on to the other measures.
Absolute Deviation:- Absolute deviation for a given data set is defined as the average of the absolute difference between the elements of the set and the mean (average deviation) or the median element (median absolute deviation).
The average deviation is calculated as follows:
which means that the average deviation is the average of the differences between each element of the data set and the mean.
The median absolute deviation is calculated as follows:
Example 1: The heights of a group of 10 students randomly selected from a given school are as follows (in ft):
5.5, 3.5, 4.6, 6.1, 5.7, 5.11, 4.9, 5.0, 5.0, 5.5
a) Find the absolute deviation from the mean.
b) Find the absolute deviation from the median.
Solution:
a) To find the absolute deviation from the mean, we need to first find the mean of the heights.
We know that the mean x̄ is given by:
Using the above, we calculate the mean as:

The mean height is 5.091 ft.
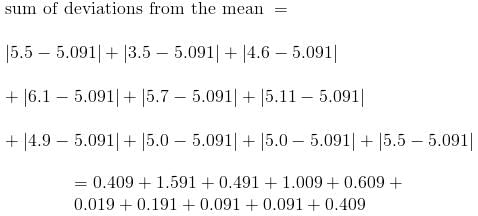
The deviation from the mean for each of the elements in the data set is obtained by subtracting the mean from that element, as follows:
For 5.5:

We find all the deviations and then take their average (remember that we only consider their absolute values):
= 4.91
Absolute deviations from the mean = 4.91/10 = 0.491
b) To find the absolute deviation from the median, we need to first find the median height for the data set.
We know that to find the median value, we arrange the elements in the data set in ascending or descending order and the find that element that lies in the middle.
Arranged in ascending order from the smallest to the largest:
Finding the median:
Since we had an even number of elements in the data set, it comes as no surprise that we're unable to obtain a median by canceling out corresponding elements. We're left with two elements and so we find their mean which then becomes our median
Having obtained our median as 5.25, we can proceed to find the average deviation from the median using the same steps as in the previous question.
= 5.19
Variance and Standard Deviation
Variance, as the name suggests, is a measure of how different the elements in a given population are. Variance is used to indicate how spread out these elements are from the mean of the population. There are two kinds of variance: population variance and sample variance.
Population variance is the variance of the entire population and is denoted by σ2 while sample variance is the variance of a sample space of the population; and is denoted by S2
Standard deviation is the square root of variance. Standard deviation is a measure of how precise the mean of a population or sample is. It is used to indicate trends in the elements in a given data set with respect to the mean, i.e, the spread of these elements from the mean.
Just as we have a population and sample variance, we also have a population and sample standard deviation. Population standard deviation is denoted by σ while the sample standard deviation is denoted by S
Although absolute deviation is also a measure of dispersion, variance and standard deviation are better measures because of the way they're calculated. Calculating variance involves squaring the differences (deviations) between the element and the mean and this makes the differences larger and thus more manageable. Making the differences larger adds a weighting factor to them making trends easier to spot.
The population variance can be calculated from the following:
where μ is the population mean.
The sample variance is given by
where x̄ is the sample mean.
Standard deviation is simply the square root of variance, so we can calculate it by taking the square root of the above variance formulae:
Population standard deviation
where μ is the population mean.
Sample standard deviation
where x̄ is the sample mean.
The difference in calculating σ2 and S2 is the average if found using the number of elements in the set for σ2. By contrast, we use one less than the sample space size for S2. The reason for this is that by using n-1 we ensure that S2 is an unbiased estimator of σ2.
|
2 videos|45 docs|4 tests
|


