Drawing Different Types of Graphs | Mathematics for Grade 10 PDF Download
Why do we need to know what graphs look like?
- Graphs are used in various aspects of mathematics – but in the real world they can take on specific meanings
- For example a linear (straight line) graph could be the path a ship needs to sail along to get from one port to another
- An exponential graph (y=kx) can be used to model population growth – for instance to monitor wildlife conservation projects
Drawing graphs – Shapes
- Recalling facts alone won’t do much for boosting your GCSE Mathematics grade!
- But being familiar with the general shapes of graphs will help you quickly recognise the sort of maths you are dealing with and features of the graph a question may refer to
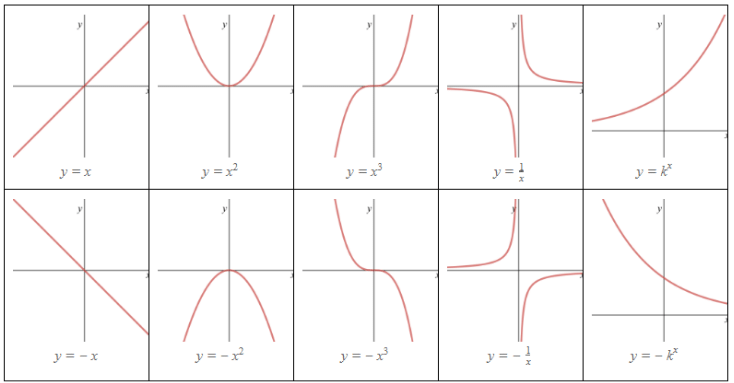
Example: Match the graphs to the equations.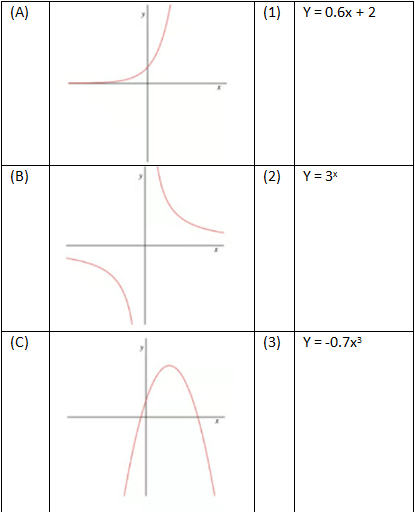
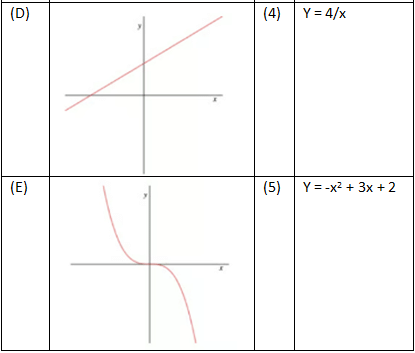
Graph A → Equation 2
Graph B → Equation 4
Graph C → Equation 5
Graph D → Equation 1
Graph E → Equation 3
How do we draw a graph using a table of values?
- Use your calculator
- THINK what the graph might look like – see the previous notes on being familiar with shapes of graphs
- Find the TABLE function on your CALCULATOR
- Enter the FUNCTION – f(x)
(use ALPHA button and x or X, depending on make/model)
(Press = when finished) - (If you are asked for another function, g(x), just press enter again)
- Enter Start, End and Step (gap between x values)
- Press = and scroll up and down to see y values
- PLOT POINTS and join with a SMOOTH CURVE
- If your calculator does not have a TABLE function then you will have to work out each y value separately using the normal mode on your calculator
- To avoid errors always put negative numbers in brackets and use the (-) key rather than the subtraction key
Example: (a) Complete the table of values for the function f(x) = x3 — 5x + 2
(b) On the graph paper provided draw the graph of y = x3 — 5x + 2
(a)
2, 3, 4, 5 — Complete the table using you calculator
(b)1- It's a positive cubic graph so you know it should look a bit like this
It is not essential to sketch the graph but you should've at least thought about it6 - Use the table from part (a) to plot the points carefully and join them up wit a smooth curve If you don't/can't get a smooth curve flowing nicely through the points you may have made a mistake so go back and double check your values and plotting
Why do we need to know what trigonometric graphs look like?
- Trigonometric Graphs are used in various applications of mathematics – for example, the oscillating nature can be used to model how a pendulum swings
Drawing Graphs – Trig Graphs
- As with other graphs, being familiar with the general style of trigonometric graphs will help you sketch them quickly and you can then use them to find values or angles alongside your calculator
- All trigonometric graphs follow a pattern – a “starting point” and then “something happens every 90°”.
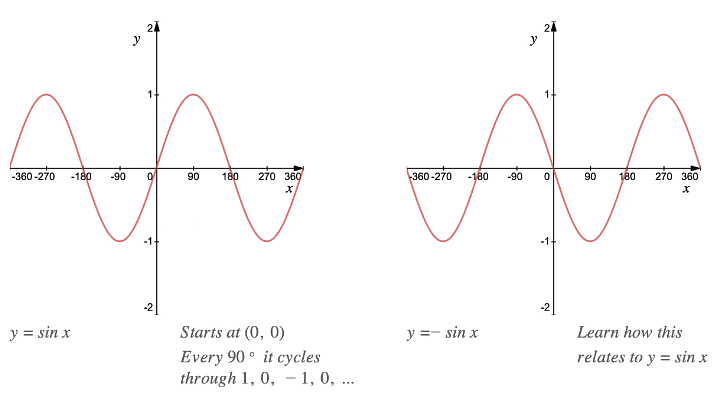
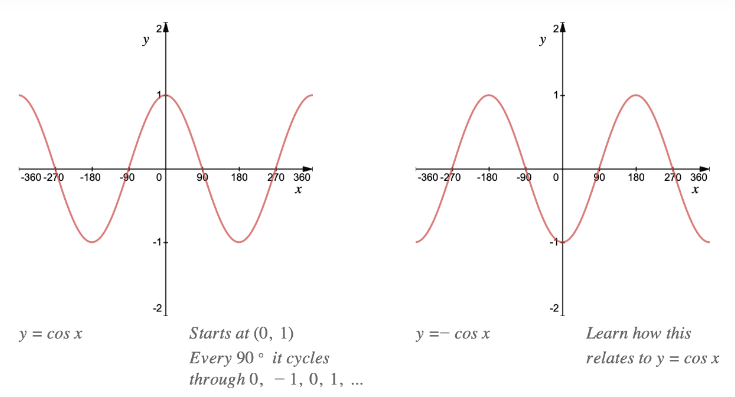
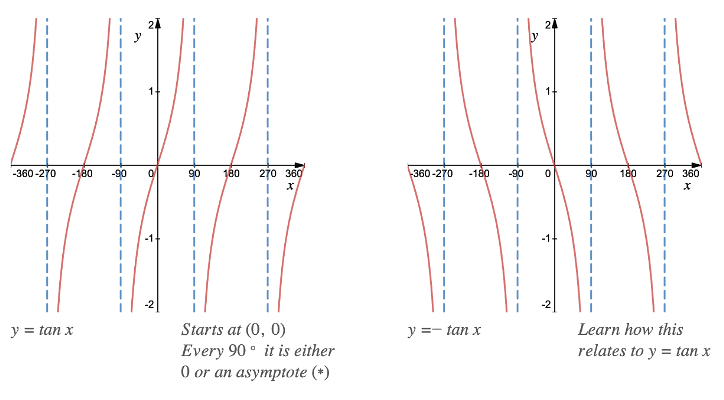
- (*) An asymptote is a line that a graph gets ever closer to without ever crossing or touching it
Example: Sketch the graph of y = cos θ for — 180° ≤ θ ≤ 540°.
Do not be put off by the use of θ (theta), it is a Greek letter often used in mathematics to denote angles
Okay we have the positive cos graph, so we start at (0, 1) and cycle round 0, — 1, 0, 1, 0, — 1, 0, etc.
It is easy to see that — 180 ° is linked to "every 90 ° " but not so obvious that 540 ° is — just count up in 90 ° steps until you reach this value or past it.
Note: It is easier to deal with the positive angles first, then work backwards from (0, 1) to deal with the negative angles
|
138 videos|101 docs|44 tests
|


