Everyday Mathematics: Pictographs | Math Olympiad for Class 2 PDF Download

Q1. The pictograph shows the number of sandwiches sold at a shop in a day.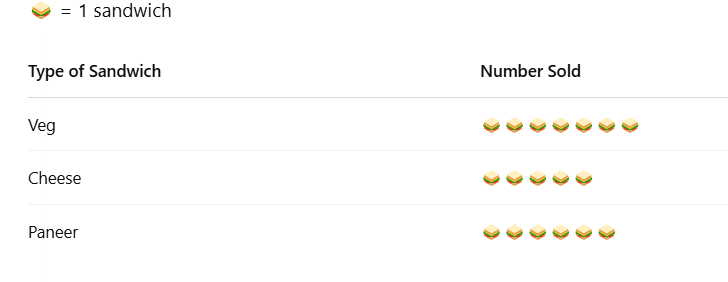
How many more Veg sandwiches were sold than Cheese sandwiches?
(a) 3
(b) 2
(c) 1
(d) 4
Ans: (b) 2
Veg = 7 sandwiches, Cheese = 5 sandwiches
→ 7 − 5 = 2
Q2. The pictograph shows the number of cupcakes sold in a bakery.
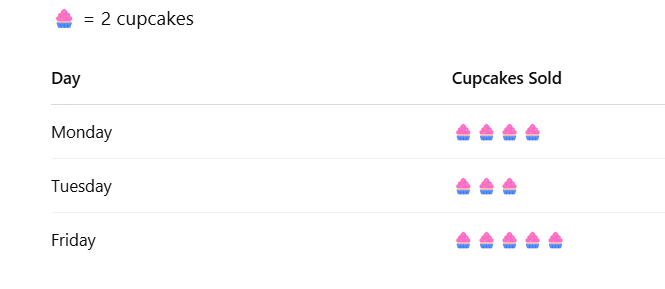
How many cupcakes were sold on Friday?
(a) 10
(b) 8
(c) 6
(d) 5
Ans: (a) 10
Each 🧁 = 2 cupcakes
→ 5 symbols = 5 × 2 = 10
Q3. A store sold toys. In a pictograph, if each symbol is 2 toys, how many symbols represent cars?
(a) 4
(b) 5
(c) 6
(d) 7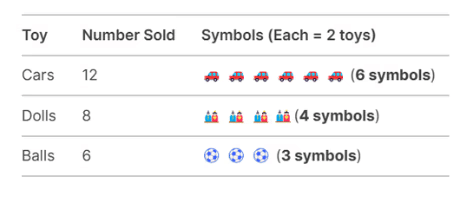 Ans: (c) 6
Here, 1 symbol = 2 toys.
Cars = 12, so 12 ÷ 2 = 6 symbols.
Cars have 6 symbols.
Q4. The pictograph shows the number of books read by 4 students.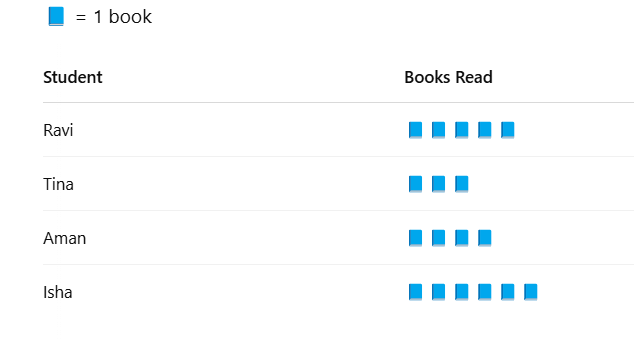
Who read the second highest number of books?
(a) Isha
(b) Aman
(c) Ravi
(d) Tina
Ans: (c) Ravi
Isha = 6, Ravi = 5, Aman = 4, Tina = 3
→ Ravi is second highest.
Q5: A farmer counted the number of eggs collected from chickens each day for 4 days using a pictograph (each egg symbol = 3 eggs):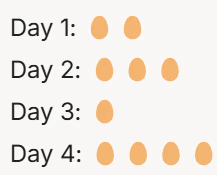
(a) 12
(b) 15
(c) 21
(d) 18
Ans: (d) 18
Calculate the eggs:
Day 1 = 2 × 3 = 6
Day 2 = 3 × 3 = 9
Day 3 = 1 × 3 = 3
Day 4 = 4 × 3 = 12.
Total = 6 + 9 + 3 + 12 = 18.
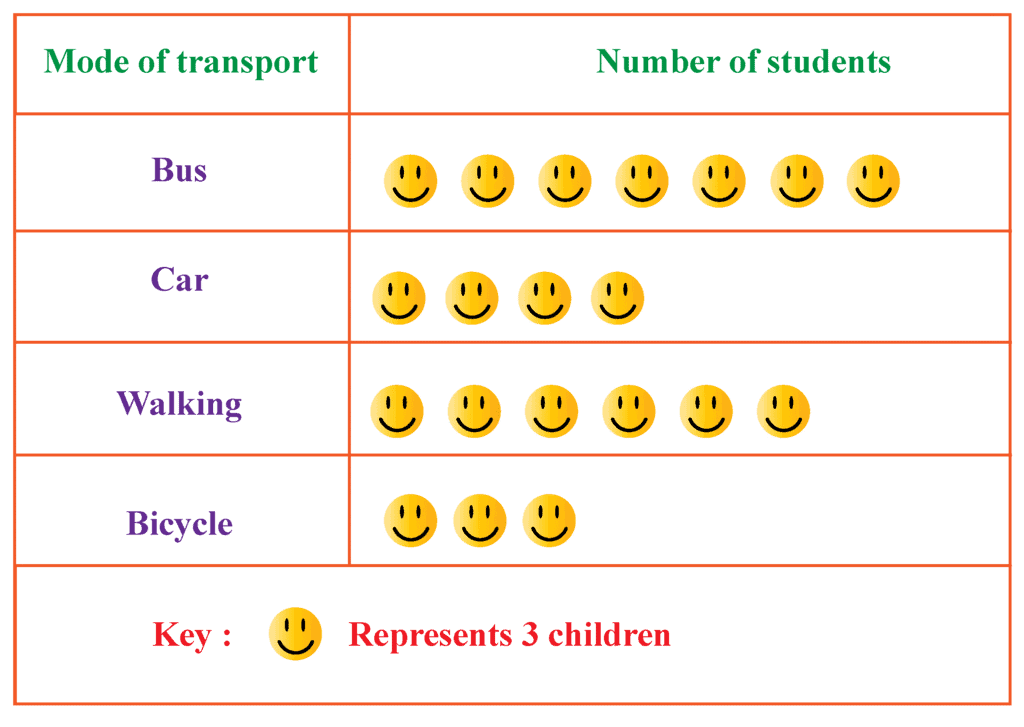
Q6. In a pictograph, each smiley represents 3 children. If there are 4 smileys in a car, how many children are there?
(a) 10
(b) 15
(c) 20
(d) 25
Ans: (c) 20
Each smiley = 3 children. With 4 smileys: 4 × 5 = 20 children.
Q7. The pictograph shows the number of toys sold at a store.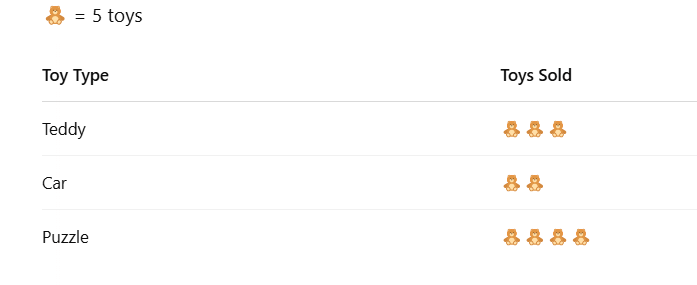
How many more puzzles were sold than cars?
(a) 10
(b) 5
(c) 15
(d) 20
Ans: (a) 10
Puzzle = 4 × 5 = 20, Car = 2 × 5 = 10
→ 20 − 10 = 10
Q8. A pictograph shows 3 Trees for Apple and 5 trees for Guava. If each tree represents 10 trees, how many more trees were there for Peach?
(a) 5
(b) 40
(c) 35
(d) 20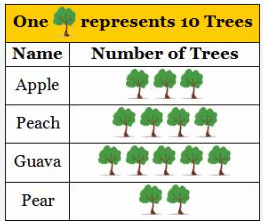
Ans: (b) 40
Each tree = 10
For Peach, there are 4 trees i.e., 4 ×10 = 40 trees.
Q9. The pictograph shows how many pencils students brought to school.
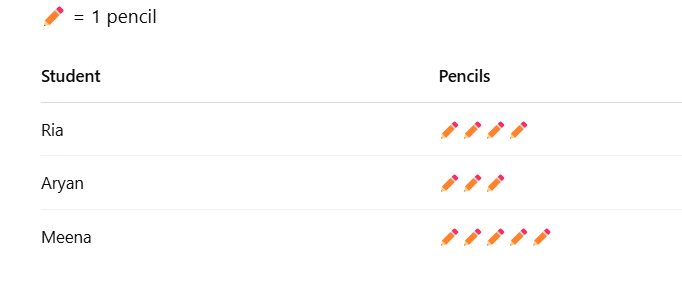
How many pencils were brought in total?
(a) 10
(b) 11
(c) 12
(d) 13
Ans: (d) 13
Ria = 4, Aryan = 3, Meena = 5
→ 4 + 3 + 5 = 12
Q10. Jake recorded the number of pizzas sold for five days. Which day sold fewer pizzas?
(a) Friday
(b) Wednesday
(c) Tuesday
(d) Monday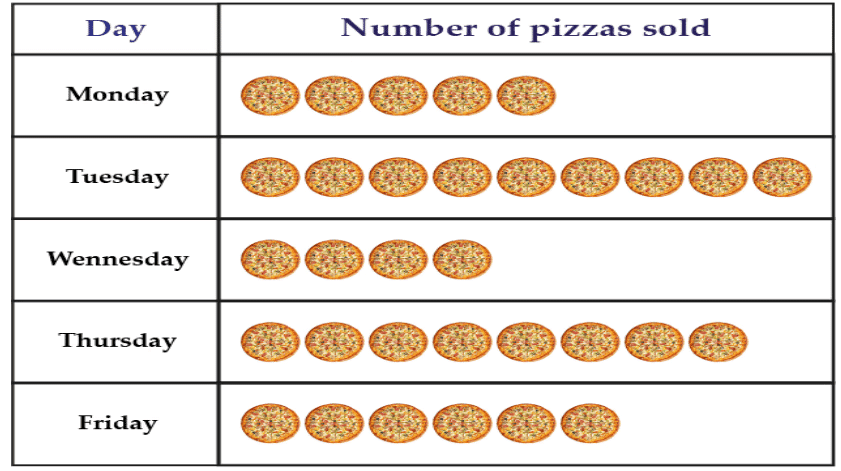
Ans: (b) Wednesday
In the pictograph, each pizza picture represents the number of pizzas sold on each day. To find which day had the fewest pizzas sold, we count the pizza pictures for each day:
- Monday → 5 pizzas
- Tuesday → 6 pizzas
- Wednesday → 3 pizzas
- Thursday → 4 pizzas
- Friday → 5 pizzas
Since Wednesday has the least number of pizzas (only 3), the correct answer is Wednesday.
|
34 videos|104 docs|84 tests
|
FAQs on Everyday Mathematics: Pictographs - Math Olympiad for Class 2
| 1. What is a pictograph and how is it used in data representation? |  |
| 2. How do you create a pictograph? | |
| 3. What are some advantages of using pictographs? | |
| 4. Can pictographs be misleading? If so, how? | |
| 5. What grade level is most appropriate for teaching pictographs? | |


MCQs
,Important questions
,Free
,mock tests for examination
,study material
,Everyday Mathematics: Pictographs | Math Olympiad for Class 2
,video lectures
,practice quizzes
,Previous Year Questions with Solutions
,ppt
,Exam
,Extra Questions
,Everyday Mathematics: Pictographs | Math Olympiad for Class 2
,Objective type Questions
,Viva Questions
,Semester Notes
,Summary
,past year papers
,shortcuts and tricks
,Everyday Mathematics: Pictographs | Math Olympiad for Class 2
,Sample Paper
;


Everyday Mathematics: Pictographs Free PDF Download
Importance of Everyday Mathematics: Pictographs
Everyday Mathematics: Pictographs Notes
Everyday Mathematics: Pictographs Class 2 Questions
Study Everyday Mathematics: Pictographs on the App
|
© EduRev
|
Education Revolution
|


|


