|
True or False: A correlation coefficient of 0 indicates a strong relationship between two variables. |
Card: 3 / 50 |
|
When the correlation coefficient is close to 1, it indicates that when one variable increases, the other variable tends to ___. |
Card: 5 / 50 |
|
Fill in the blank: A correlation coefficient close to -1 suggests a ___ relationship. |
Card: 7 / 50 |
|
Riddle: I measure the strength and direction of a relationship but my value ranges from -1 to 1. What am I? |
Card: 11 / 50 |
|
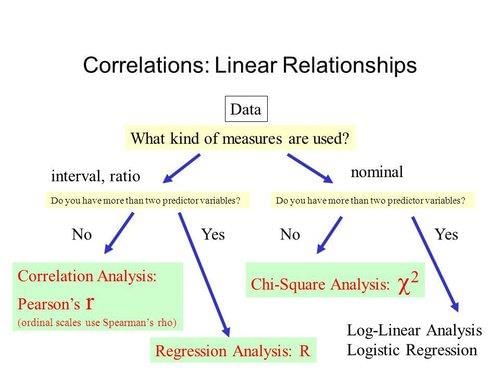
True or False: The correlation coefficient is meaningful for variables measured at the nominal level. |
Card: 13 / 50 |
|
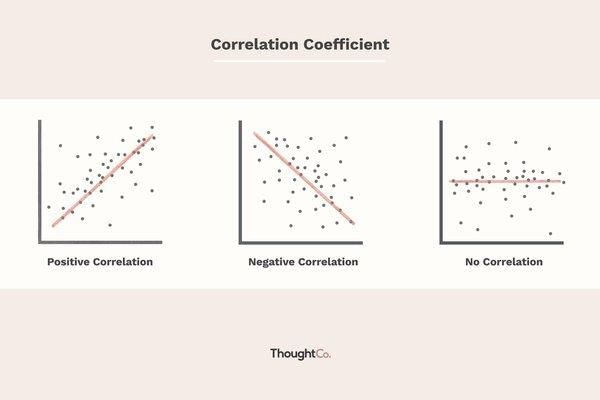
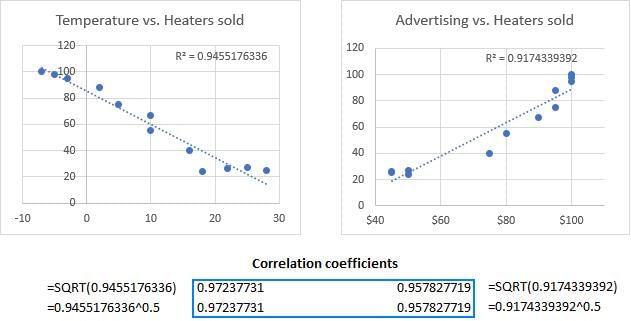
A negative correlation occurs when two variables move in opposite directions; as one variable increases, the other decreases. An example is the sale of woollen garments and day temperature. 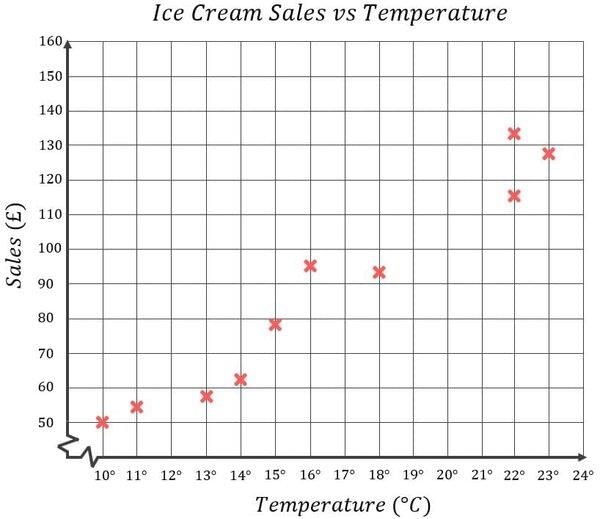 |
Card: 16 / 50 |
|
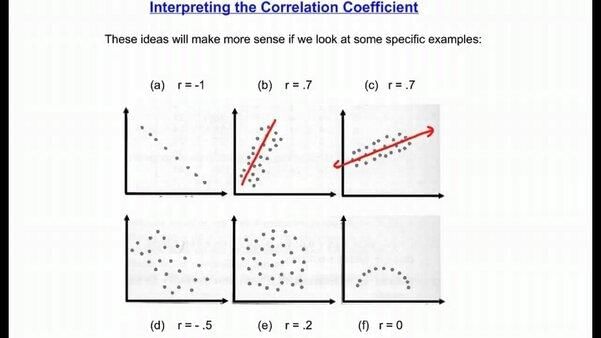
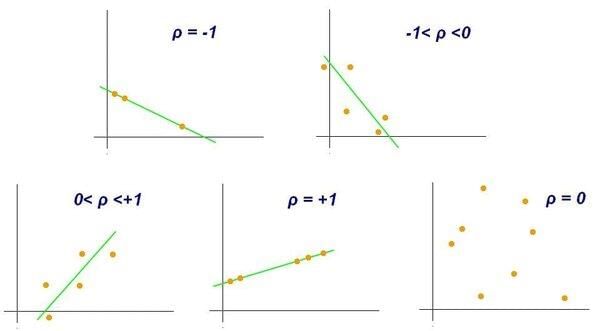
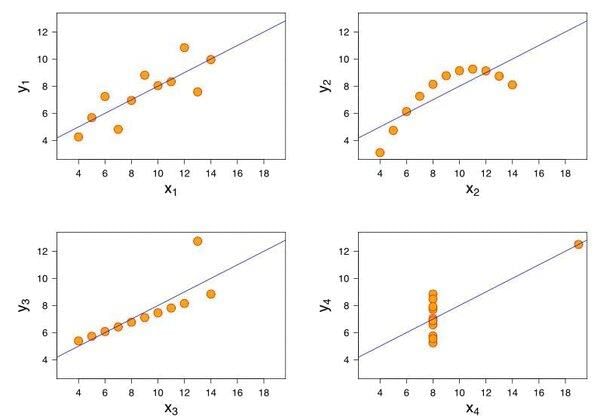
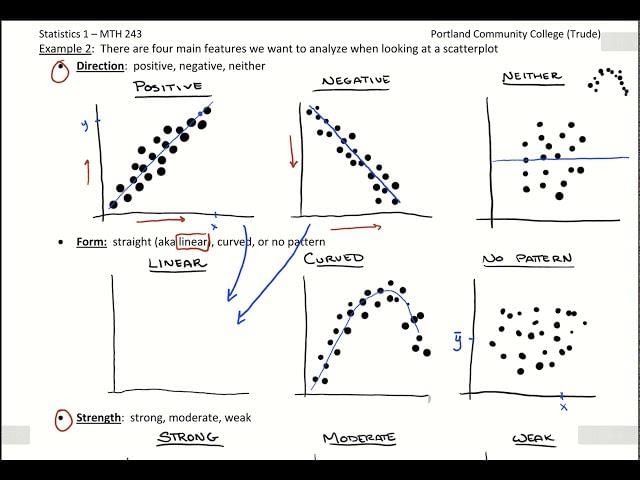
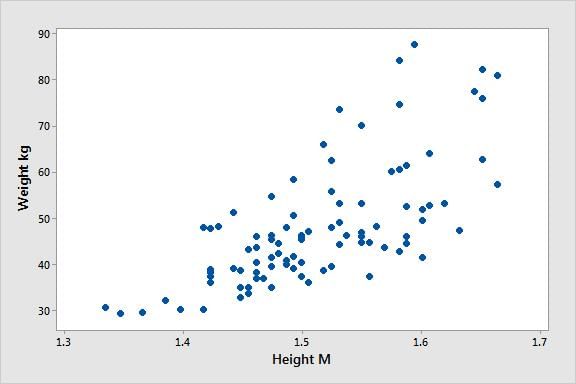
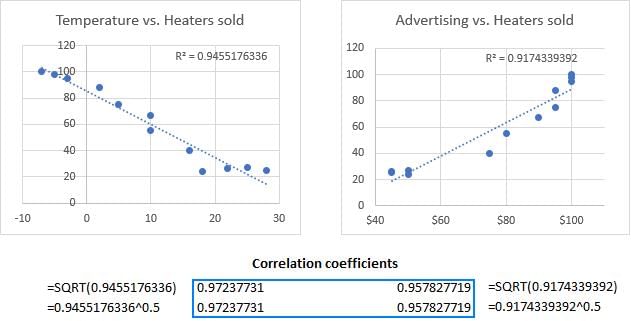
Fill in the blank: A scatter plot is used to visually represent the ___ and ___ of correlation between two variables. |
Card: 17 / 50 |
|
True or False: Positive correlation implies that an increase in one variable leads to a decrease in another variable. |
Card: 19 / 50 |
|
False. Positive correlation implies that an increase in one variable is accompanied by an increase in the other. 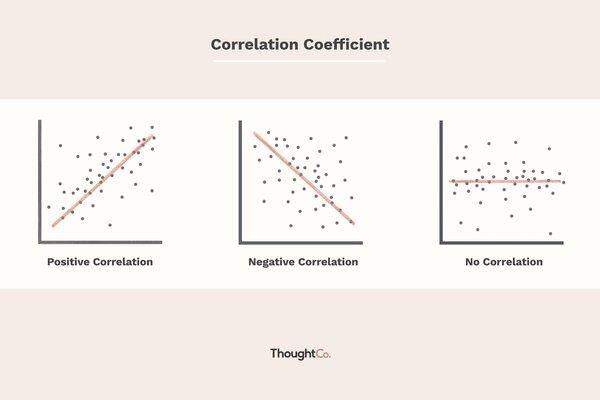 |
Card: 20 / 50 |
|
Riddle: I show the relationship between two things, points scattered across my frame. I'm not a graph for just any purpose, but I help you see correlation's name. What am I? |
Card: 21 / 50 |
|
It indicates the degree of linear relationship between two variables, providing a precise numerical value. |
Card: 24 / 50 |
|
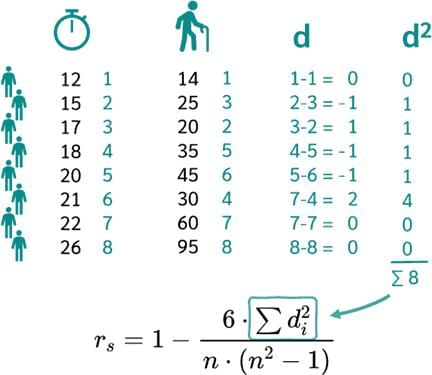
Fill in the blank: Examples of methods for estimating correlation include scatter diagram, Karl Pearson’s coefficient of correlation, and ___ rank correlation. |
Card: 25 / 50 |
 Unlock all Flashcards with EduRev Infinity Plan Starting from @ ₹99 only
|
|
True or False: The closer the points in a scatter plot are to a straight line, the weaker the correlation between the variables. |
Card: 29 / 50 |
|
False. The closer the points are to a straight line, the stronger the correlation. 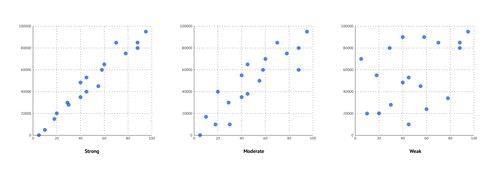 |
Card: 30 / 50 |
|
Fill in the blank: In the step deviation method, dx represents the deviation of the X-series from the ___ mean. |
Card: 33 / 50 |
|
True or False: The assumed mean method requires calculating the sum of deviations from the actual mean. |
Card: 35 / 50 |
|
What are the two main methods used to calculate Karl Pearson’s coefficient of correlation? |
Card: 37 / 50 |
|
Riddle: I’m a measure that shows the strength of a relationship, but I’m not a friend. What am I? |
Card: 39 / 50 |
|
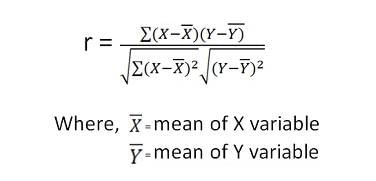
Σx is the standard deviation of the X-series and σy is the standard deviation of the Y-series. 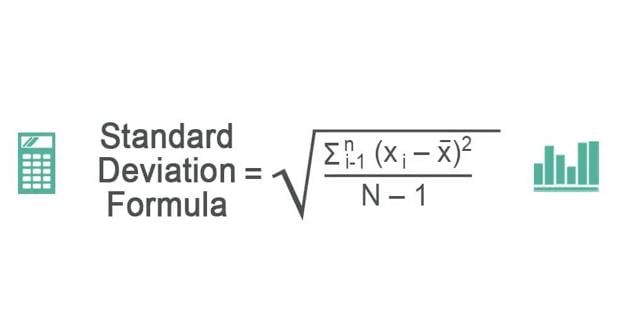 |
Card: 42 / 50 |
|
Fill in the blank: The step deviation method is particularly useful when the values of the variables are ___. |
Card: 43 / 50 |
|
What does the variable N represent in the formula for calculating the coefficient of correlation? |
Card: 45 / 50 |
|
It is used to determine the correlation between variables that may not have a clear or objective measurement, particularly in qualitative variables. |
Card: 48 / 50 |


