How to Attempt the Writing Task 1 | Writing for Academic IELTS PDF Download
| Table of contents |
|
| What is IELTS Writing Task 1? |
|
| Types of Questions in Writing Task 1 |
|
| Tips for Answering IELTS Writing Task 1 Questions |
|
| Writing Task 1 Example with Detailed Guidelines |
|

What is IELTS Writing Task 1?
- IELTS Writing Task 1 is an integral component of the IELTS Academic Writing test, designed to assess your ability to interpret and describe visual data in a clear, organized, and objective manner.
- In this task, you will be presented with a visual representation of information—such as a bar chart, line graph, pie chart, table, diagram, map, or process—and asked to summarize and explain the key features in your own words.
- This task is especially important for students aiming to pursue higher education in English-speaking countries, as it tests the skills needed to understand and describe factual data, trends, and comparisons—similar to what is expected in academic coursework.
The IELTS Writing test is 60 minutes long and consists of two tasks:
- Task 1: Describe visual information (minimum 150 words recommended)
- Task 2: Write an essay in response to an argument or point of view (minimum 250 words recommended)
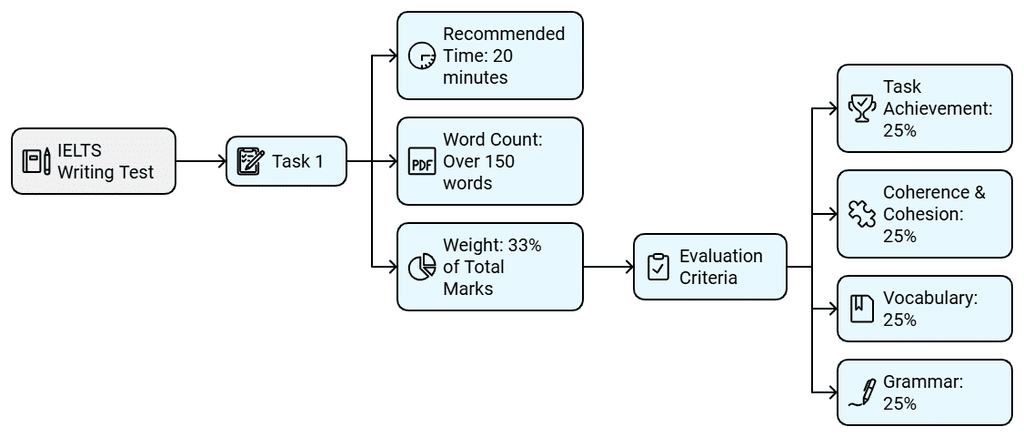
Although Task 1 is shorter, it still carries significant weight—it contributes 33% of your total Writing band score. IELTS recommends spending no more than 20 minutes on Task 1 so that you have enough time to complete Task 2. However, you can manage your time as you see fit.
You will be evaluated on four key assessment criteria, each contributing 25% to your Task 1 score:
- Task Achievement – How well you address the task and highlight the key features of the visual.
- Coherence and Cohesion – How logically your ideas are organized and connected.
- Lexical Resource (Vocabulary) – The range and accuracy of your word choice.
- Grammatical Range and Accuracy – Your ability to use a variety of grammatical structures correctly.
Understanding the format and scoring system is crucial to planning your answer effectively and maximizing your band score.
Types of Questions in Writing Task 1
You will be presented with one of the following graphics:
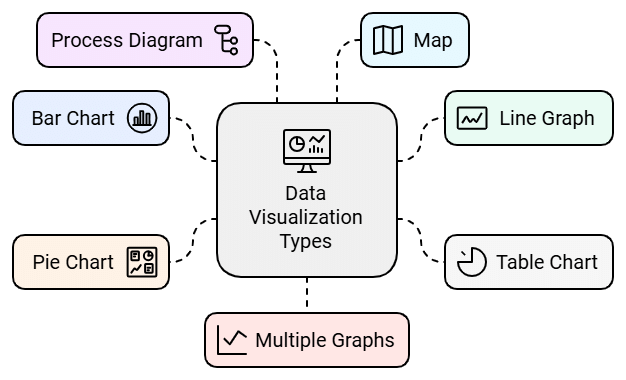
1. Bar Chart
A bar chart presents data visually using rectangular bars. These bars can occur either horizontally or vertically. You may also be given two charts to summarise and contrast in one task. In writing task 1 of the IELTS academic exam, you will always be given a description of the chart as well as key information you need to understand the chart, such as:
- A title and/or statement explaining the chart
- A key/legend that explains the color coding of the chart
- A labelled vertical Y axis
- A labelled horizontal X axis
Example: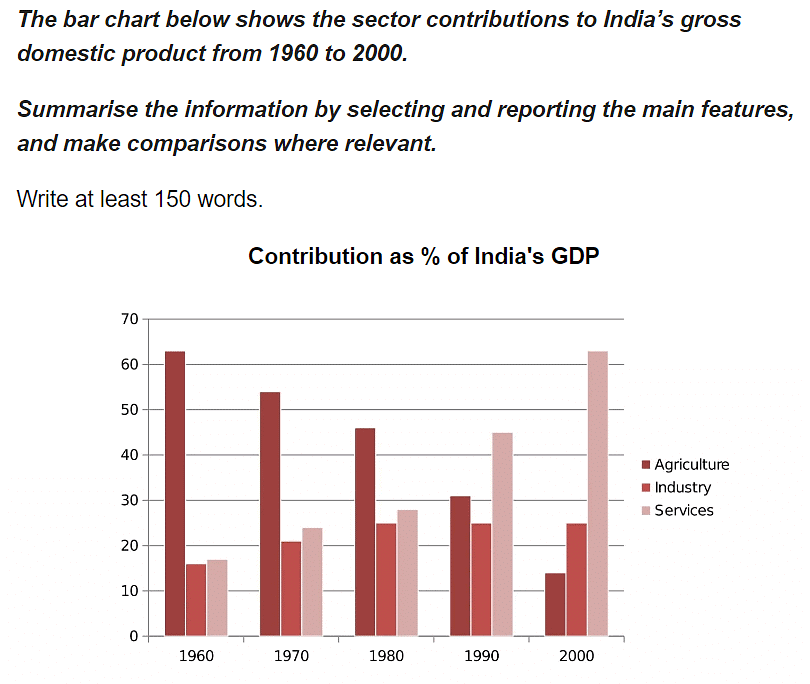
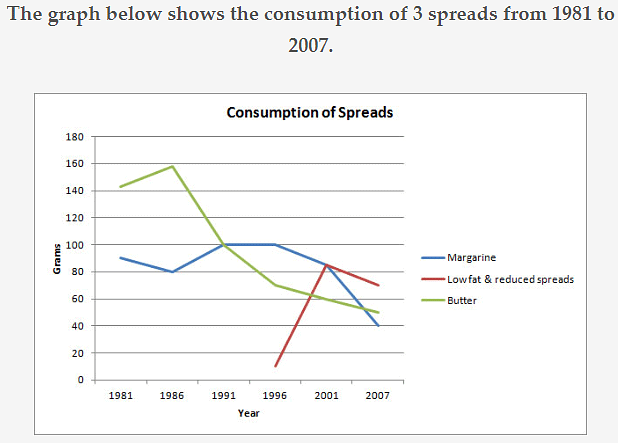
2. Line Graph
3. Table Chart
One type of IELTS writing task 1 is a table that presents information in columns and rows.
You may be given one table or two tables. Describing a table in IELTS is the same as describing a bar graph. In the IELTS writing task 1 table chart question, you need to compare and contrast the data that is given. While writing, we need to ensure the table chart vocabulary and that it is unique and engaging.
Example: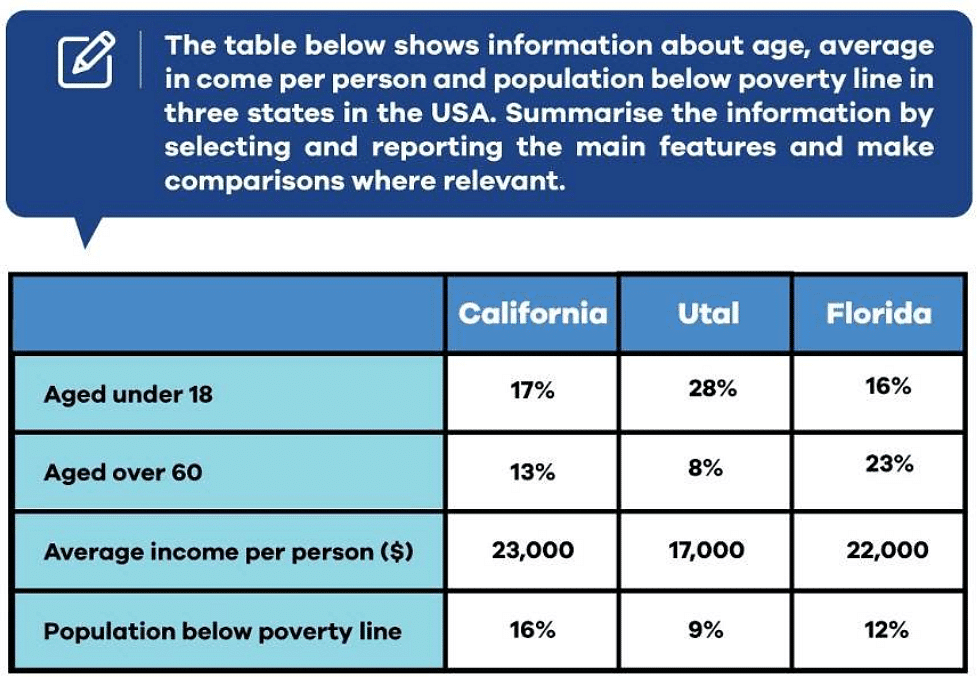
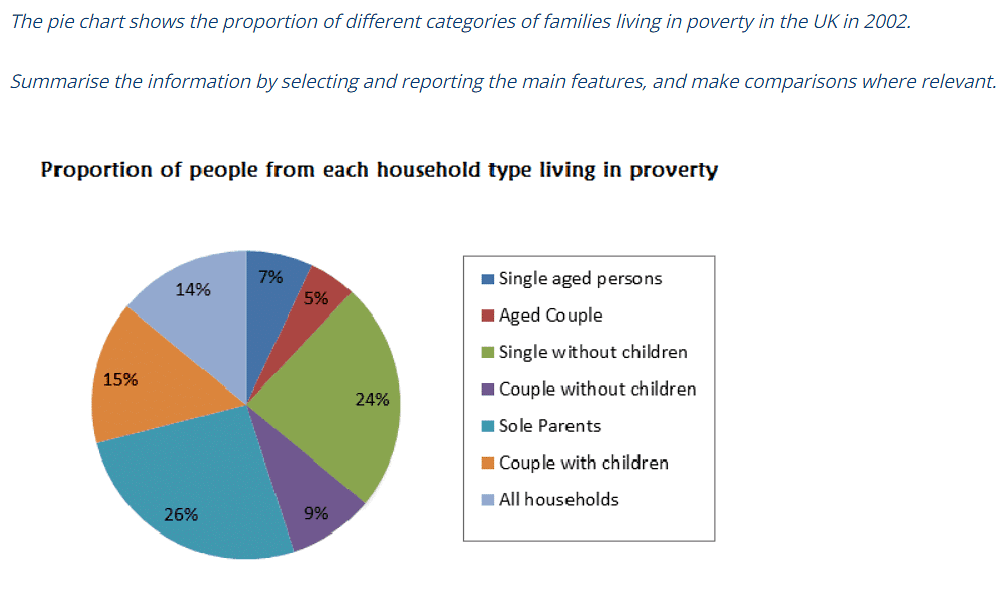
4. Pie Chart
You may be presented with a visual representation of data, such as a pie chart, and you will be required to describe the information presented in your own words. In a pie chart, then you will need to analyze and interpret the data presented and write a report summarizing the key features of the chart, including any trends or patterns.
Example:
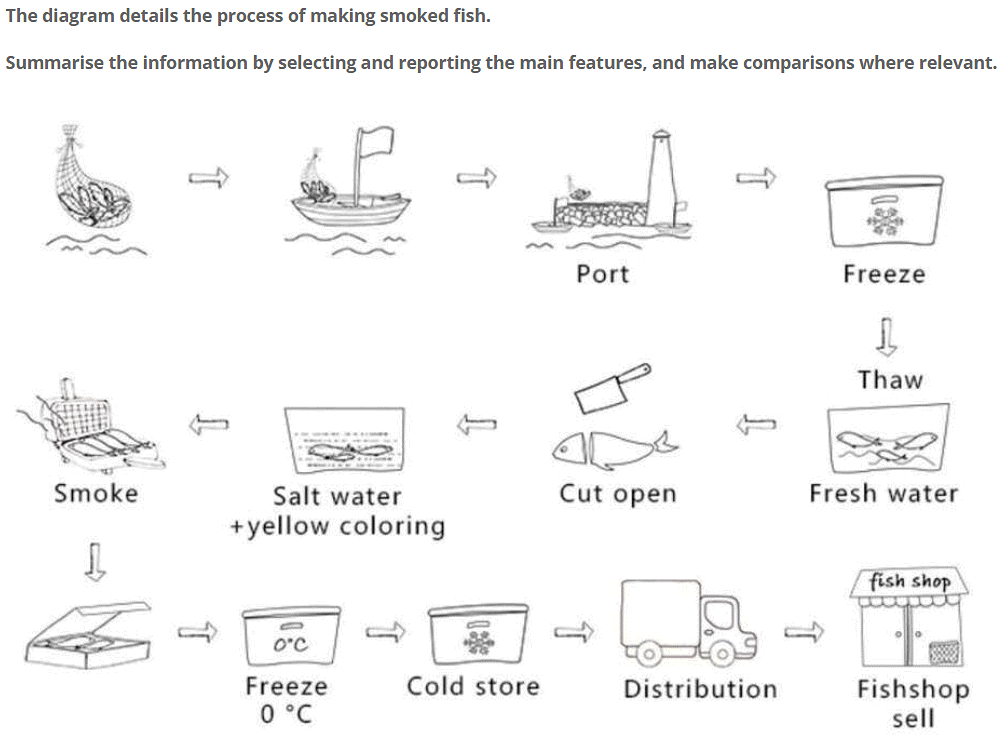
5. Process Diagram
You may be presented with a visual representation of a process, such as a diagram, flowchart or cycle diagram, and you will be required to describe the stages of the process in your own words. In the process diagram, you will need to analyze and interpret the information presented and write a report summarizing the key features of the diagram, including any important stages, materials used, or changes that occur throughout the process.
Example:
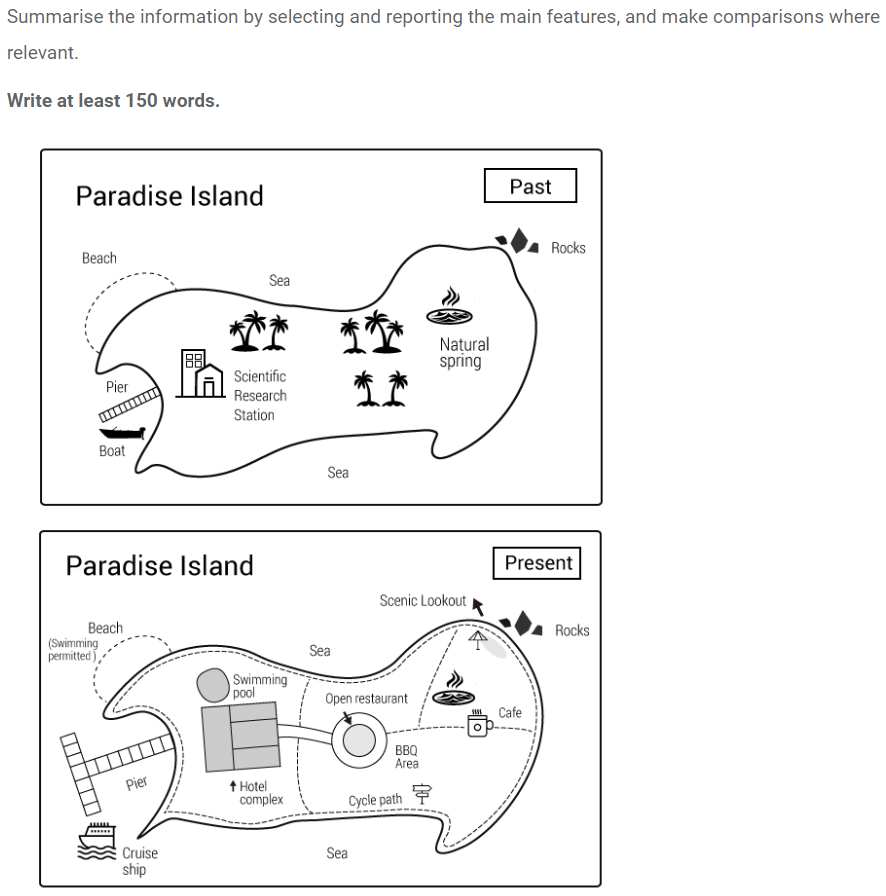
6. Map
In map-type questions, you will need to analyze and interpret the information presented and write a report summarizing the key features of the map, including any landmarks, geographical features, or changes in the area depicted. There are three main types of map questions:
- Describe one map in the present day.
- Describe two maps- one in the present and one in the future.
- Describe two maps- one in the past and one in the present.
Example:
7. Multiple Graphs
Multiple graph type questions refer to tasks where you are given more than one graph or chart to analyze and describe. Here are some examples of multiple graph type questions:- Line graph and table: You may be presented with a line graph showing a trend over time and a table with specific data points related to the trend. You will need to analyze both the line graph and the table and then present a summary of the key features and trends.
- Bar chart and pie chart: A bar chart may show the distribution of a certain variable across different categories, while a pie chart could display the percentage contribution of each category to a whole. You will need to compare and contrast the information from both charts and summarize the key points.
- Flowchart and diagram: You might be given a flowchart illustrating a process and a diagram showing the components of a system or object. In this case, you need to describe the process in the flowchart and explain how the different components in the diagram are related to the process.
- Map and table: A map may show the geographical distribution of a certain variable, while a table provides specific data points or statistics for different locations. You will need to analyze and describe the information from both the map and the table and present a summary of the key findings.
- Combination of multiple charts: Sometimes, you may be given a combination of different graphs, such as a line graph, bar chart, and pie chart, all related to the same topic. In this case, you will need to analyze and describe the key features and trends from all the graphs and provide a coherent summary of the overall information.
In all these cases, it's important to identify the main trends, patterns, or features in the graphs and charts, and present a clear and organized summary of the information. Make sure to use appropriate vocabulary, grammar, and structure in your response.
Tips for Answering IELTS Writing Task 1 Questions
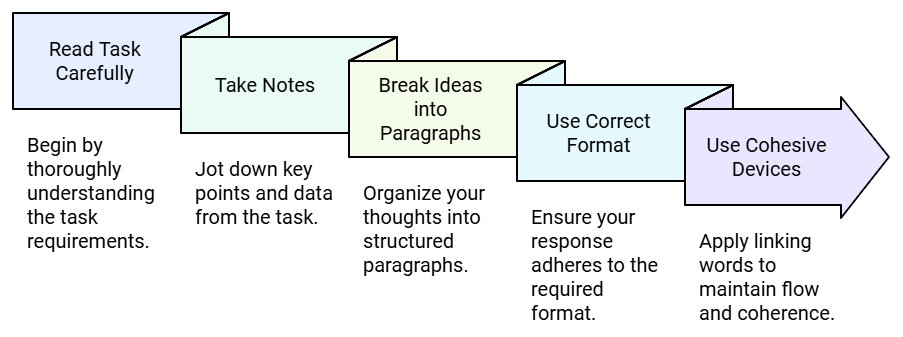
Tip 1: Carefully Analyze the Task Before Writing
Before you begin writing, take a few moments to fully understand the task. Carefully read the question prompt and analyze the visual data presented. This step ensures that your response is focused and relevant.
What to do:
Highlight keywords in the task to identify the main focus.
Take brief notes on what stands out in the graph or diagram (e.g., trends, highest/lowest values, comparisons).
Create a quick outline to organize your thoughts logically.
Consider grouping similar data or trends to structure your paragraphs better.
Tip 2: Structure Your Ideas Into Clear Paragraphs
To keep your writing clear and easy to follow, make sure to present one main idea per paragraph. Each paragraph should focus on a specific aspect of the data—such as a particular trend, group, or comparison—rather than combining multiple points in a single paragraph.
Why this matters:
It improves clarity and helps the examiner understand your interpretation of the data.
It prevents overcrowding of ideas, which can reduce coherence.
It allows you to expand each idea with specific figures and comparisons.
Avoid mixing unrelated information in one paragraph. Instead, think of each paragraph as a unit that explains one idea in detail before moving to the next.
Tip 3: Follow the Appropriate Academic Format
IELTS Writing Task 1 requires a formal, academic tone. Your answer should follow a structured format to effectively present the data.
Format Checklist:
Introduction – Rewrite the question in your own words (paraphrasing).
Overview – Summarize the main trend(s) or significant features without including detailed numbers.
Body – Provide specific comparisons, patterns, and figures using appropriate vocabulary and grammar.
Tip 4: Use Cohesive Devices for Smooth Flow
Cohesive devices (linking words and phrases) help your ideas flow logically and make your writing easier to follow.
Useful cohesive devices:
To show contrast: however, on the other hand, whereas
To add information: furthermore, in addition, also
To sequence ideas: first, secondly, next, finally
To illustrate result: therefore, as a result, so
Use these naturally—don’t overuse them or force them into every sentence.
Writing Task 1 Example with Detailed Guidelines
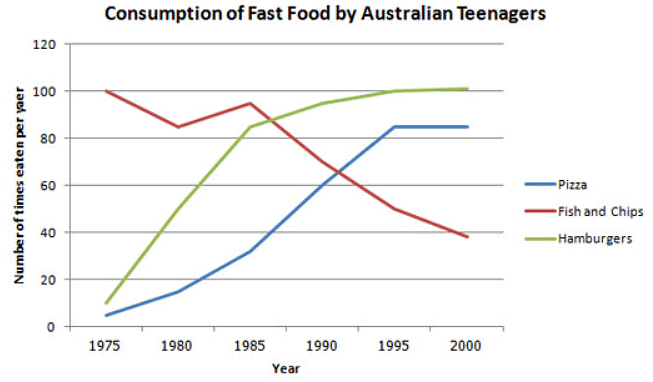
Question Statement: The line graph below shows changes in the amount and type of fast food consumed by Australian teenagers from 1975 to 2000. Summarize the information by selecting and reporting the main features and make comparisons where relevant.
1. Introduce the Graph
Start your response with one or two sentences that introduce what the graph shows. This involves paraphrasing the question statement, ensuring you include any time period mentioned.
Here is an example of the above line graph:
The line graph compares the fast food consumption of teenagers in Australia between 1975 and 2000, a period of 25 years.
2. Give an Overview
YAfter introducing the graph, provide a brief overview of the key trends. Avoid going into specific data at this stage. Focus instead on describing the general patterns.
Here is an example:
Overall, while the consumption of fish and chips steadily declined over the period, the intake of pizza and hamburgers rose significantly.
This overview highlights the major trends observed throughout the timeline. In IELTS Writing Task 1, the overview can be placed either after the introduction or at the end as a conclusion—what matters is that it’s included.
3. Give the Details
Now, develop your body paragraphs with specific details from the graph. Use the data effectively and organize the content logically by grouping similar trends together.
When writing the details:
Refer to actual data points (figures and years).
Group similar patterns to create coherent paragraphs.
Emphasize comparisons and contrasts to show your analytical skills.
In this graph, as noted in the overview, fish and chips follow a declining trend, while both pizza and hamburgers show rising trends. This makes it natural to structure your body as follows:
One paragraph focusing on fish and chips
Another paragraph discussing pizza and hamburgers
This grouping helps present your response in a structured and readable format.
Here is an example of the first paragraph:
In 1975, the most popular fast food with Australian teenagers was fish and chips, being eaten 100 times a year. This was far higher than Pizza and hamburgers, which were consumed approximately 5 times a year. However, apart from a brief rise again from 1980 to 1985, the consumption of fish and chips gradually declined over the 25 year timescale to finish at just under 40.
As you can see, the focus is on fish and chips. This does not mean you should not mention the other two foods, as you should still make comparisons of the data as the questions asks.
The second body then focuses on the other foods:
In sharp contrast to this, teenagers ate the other two fast foods at much higher levels. Pizza consumption increased gradually until it overtook the consumption of fish and chips in 1990. It then levelled off from 1995 to 2000. The biggest rise was seen in hamburgers as the occasions they were eaten increased sharply throughout the 1970’s and 1980’s, exceeding that of fish and chips in 1985. It finished at the same level that fish and chips began, with consumption at 100 times a year.
|
30 videos|206 docs|17 tests
|
FAQs on How to Attempt the Writing Task 1 - Writing for Academic IELTS
| 1. What is IELTS Writing Task 1 and what does it involve? |  |
| 2. How much time should I spend on IELTS Writing Task 1? | |
| 3. What are common types of visual data presented in IELTS Writing Task 1? | |
| 4. How is IELTS Writing Task 1 scored? | |
| 5. Can I use bullet points or lists in my IELTS Writing Task 1 response? | |


Sample Paper
,Extra Questions
,Free
,past year papers
,Summary
,Exam
,shortcuts and tricks
,How to Attempt the Writing Task 1 | Writing for Academic IELTS
,Objective type Questions
,video lectures
,study material
,practice quizzes
,Previous Year Questions with Solutions
,MCQs
,How to Attempt the Writing Task 1 | Writing for Academic IELTS
,Viva Questions
,Semester Notes
,Important questions
,How to Attempt the Writing Task 1 | Writing for Academic IELTS
,mock tests for examination
,ppt
;


How to Attempt the Writing Task 1 Free PDF Download
Importance of How to Attempt the Writing Task 1
How to Attempt the Writing Task 1 Notes
How to Attempt the Writing Task 1 IELTS Questions
Study How to Attempt the Writing Task 1 on the App
|
© EduRev
|
Education Revolution
|


|


