Important Diagrams: Improvement in Food Resources | Science Class 9 PDF Download

Q1: Answer the following questions based on the diagram given below:
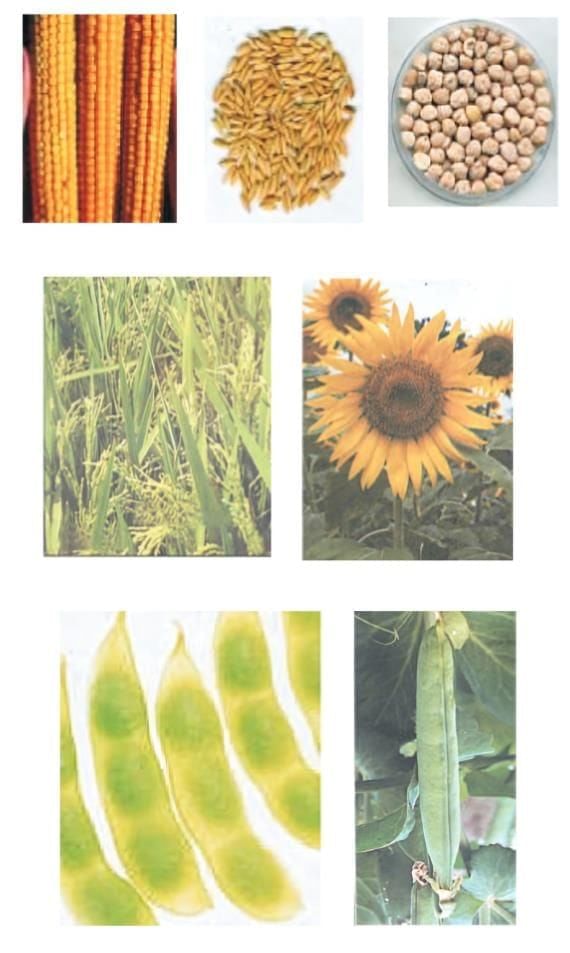
(i) Identify two cereal crops shown in the image.
Ans: The two cereal crops shown in the image are maize (top-left) and paddy (rice) (middle left)
(ii) Which crop shown in the image is an oilseed?
Ans: Sunflower (middle-right) is the oilseed crop shown in the image. Its seeds are used to extract sunflower oil.
(iii) Which crop shown in the image belongs to the leguminous family and improves soil fertility?
Ans: Gram (chickpea) and pea belong to the leguminous family and help improve soil fertility through nitrogen fixation.
(iv) Which among the crops in the image is known for growing well in waterlogged fields?
Ans: Paddy (rice) (middle-left) grows well in waterlogged fields and requires standing water.
(v) Why are pulses like gram and pea important in crop rotation?
Ans: Pulses like gram and pea are important in crop rotation because they fix atmospheric nitrogen in the soil, improving soil fertility for the next crop.
Q2: Answer the following questions based on the diagram given below: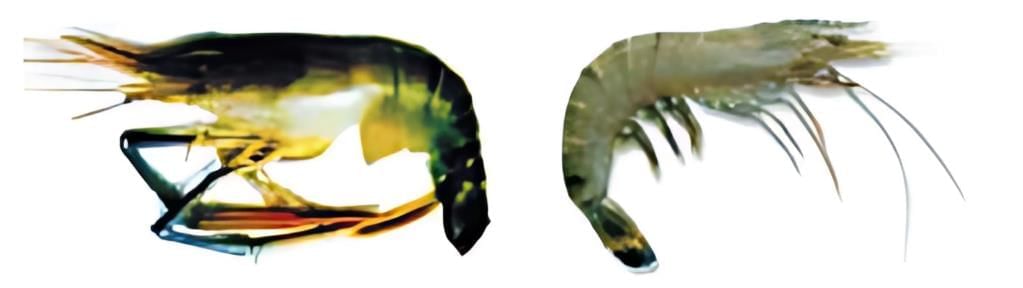
(i) Identify the two species shown in the image and mention their habitat.
Ans:
- Macrobrachium rosenbergii – lives in freshwater
- Penaeus monodon – lives in marine (salt) water
(ii) What are the two main methods of obtaining fish?
Ans: The two methods are:
Capture fishing – catching fish from natural resources.
Culture fishery – farming fish in controlled environments.
(iii) What is mariculture? Give an example.
Ans: Mariculture is the culture (farming) of marine organisms in seawater. Example: Farming Penaeus monodon (marine prawn) in coastal ponds.
(iv) How is fish locating made easier in marine fishing today?
Ans: Fish locating is made easier by using satellites and echo-sounders to detect large schools of fish.
(v) Apart from finned fish, name two types of shellfish that are important in marine fisheries.
Ans: Two important shellfish in marine fisheries are:
1. Prawns
2. Mussels or oysters
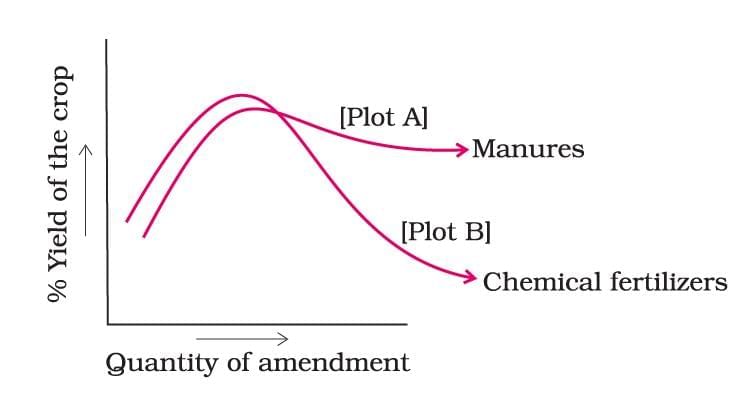
Q3: The Figure shows that the two crop fields [plots A and B] have been treated by manure and chemical fertilisers, respectively, keeping other environmental factors the same.
Observe the graph and answer the following questions.
(i) Why does plot B show a sudden increase and then a gradual decrease in yield?
(ii) Why is the highest peak in plot A graph slightly delayed?
(iii) What is the reason for the different pattern of the two graphs? [NCERT Exemplar]
 Ans:
Ans:
(i)Plot B shows a sudden increase due to the immediate release of nutrients (N, P, K) from chemical fertilisers. However, over time, their continuous use reduces microbial activity and organic content, leading to a decline in soil fertility and hence, lower yield.
(ii) In plot A, the peak is delayed because manures release nutrients slowly. They improve soil structure and increase microbial activity over time, enhancing long-term fertility.
(iii) Plot A (manure) shows sustainable yield due to gradual nutrient release and enhanced soil health from organic matter.
Plot B (chemical fertilisers) initially boosts yield, but continuous use depletes soil microbes and reduces fertility, causing a decline in yield.
|
84 videos|541 docs|60 tests
|
FAQs on Important Diagrams: Improvement in Food Resources - Science Class 9
| 1. What are the major factors contributing to the improvement of food resources? |  |
| 2. How has the Green Revolution impacted food production? | |
| 3. What role do sustainable agricultural practices play in food resource improvement? | |
| 4. Why is research and development important in enhancing food resources? | |
| 5. What are the challenges faced in improving food resources globally? | |


Important Diagrams: Improvement in Food Resources | Science Class 9
,past year papers
,Summary
,ppt
,Free
,Previous Year Questions with Solutions
,Extra Questions
,Viva Questions
,practice quizzes
,study material
,Sample Paper
,mock tests for examination
,video lectures
,Important Diagrams: Improvement in Food Resources | Science Class 9
,MCQs
,Objective type Questions
,Important questions
,Exam
,Semester Notes
,shortcuts and tricks
,Important Diagrams: Improvement in Food Resources | Science Class 9
;


Important Diagrams: Improvement in Food Resources Free PDF Download
Importance of Important Diagrams: Improvement in Food Resources
Important Diagrams: Improvement in Food Resources Notes
Important Diagrams: Improvement in Food Resources Class 9 Questions
Study Important Diagrams: Improvement in Food Resources on the App
|
© EduRev
|
Education Revolution
|


|


