Important Diagrams: Motion | Science Class 9 PDF Download

Q1: Answer the following questions based on the diagram given below:
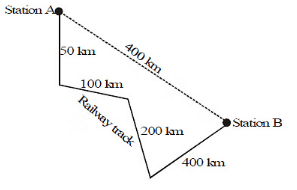
A train goes from station A to station B as shown in the figure.
(a) the distance travelled by train
(b) the magnitude of the displacement of the train on reaching station B.
Ans:
(a) Distance travelled by the train = 50 + 100 + 200 + 400 = 750 km.
(b) Magnitude of the displacement in going from station A to station B = 400 km.
Q2: Answer the following questions based on the diagram given below: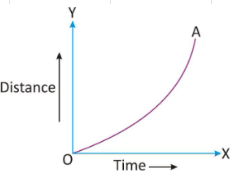
(i) What does the x-axis represent in the distance-time graph?
Ans: The x-axis represents time (in seconds) in the distance-time graph.
(ii) How can you determine the speed of an object from a distance-time graph?
Ans: The speed of an object at a particular point on the distance-time graph can be calculated by finding the slope of the tangent at that point.
(iii) Describe the motion of the object when the distance-time graph shows a curve.
Ans: When the distance-time graph shows a curve, it indicates non-uniform motion. This means that the object is changing its speed as time passes.
(iv) What does a steeper slope on a distance-time graph represent?
Ans: A steeper slope on a distance-time graph represents a higher speed or velocity of the object.
(v) Is it possible for an object to have a negative slope on a distance-time graph? If yes, what does it signify?
Ans: Yes, it's possible for an object to have a negative slope on a distance-time graph. A negative slope indicates that the object is moving in the opposite direction (e.g., moving back or towards the origin) from the initial position.
Q3: Answer the following questions based on the diagram given below:
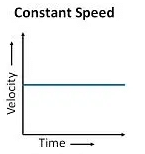
(i) What does a straight horizontal line on a velocity-time graph represent?
Ans: A straight horizontal line on a velocity-time graph represents constant speed. In this case, the object is moving with a constant velocity, and there is no change in its speed over time.
(ii) How can you find the distance travelled by an object from a velocity-time graph?
Ans: To find the distance travelled by an object from a velocity-time graph, you need to calculate the area under the graph. The area between the velocity-time graph and the time axis represents the distance travelled. For shapes like a rectangle, you can multiply the length (time) by the height (velocity) to find the distance.
(iii) What does a sloping straight line on a velocity-time graph indicate?
Ans: A sloping straight line on a velocity-time graph represents uniform acceleration. This means that the object is changing its velocity at a constant rate, either speeding up or slowing down uniformly.
(iv) How can you calculate acceleration from a velocity-time graph?
Ans: To calculate acceleration from a velocity-time graph, you can determine the slope of the line. Acceleration is equal to the change in velocity divided by the change in time. So, the slope of the line (the steepness) represents the acceleration.
(v) What does a curved line on a velocity-time graph suggest?
Ans: A curved line on a velocity-time graph suggests non-uniform (variable) acceleration. In this case, the object is changing its velocity, and the acceleration is not constant. The curvature of the line indicates that the acceleration is changing over time.
|
84 videos|384 docs|61 tests
|
FAQs on Important Diagrams: Motion - Science Class 9
| 1. What are the different types of motion in physics? |  |
| 2. How can motion be represented in diagrams? | |
| 3. What is the importance of understanding motion in physics? | |
| 4. What equations are used to describe linear motion? | |
| 5. How do forces affect the motion of an object? | |


Previous Year Questions with Solutions
,Important questions
,Exam
,Important Diagrams: Motion | Science Class 9
,practice quizzes
,Sample Paper
,Extra Questions
,Viva Questions
,past year papers
,Summary
,Important Diagrams: Motion | Science Class 9
,Free
,Semester Notes
,shortcuts and tricks
,study material
,Important Diagrams: Motion | Science Class 9
,ppt
,MCQs
,Objective type Questions
,mock tests for examination
,video lectures
;


Important Diagrams: Motion Free PDF Download
Importance of Important Diagrams: Motion
Important Diagrams: Motion Notes
Important Diagrams: Motion Class 9 Questions
Study Important Diagrams: Motion on the App
|
© EduRev
|
Education Revolution
|


|


