Class 9 Exam > Class 9 Notes > Mathematics (Maths) Class 9 > Important Formulas: Statistics
Important Formulas: Statistics | Mathematics (Maths) Class 9 PDF Download
Important Formulas
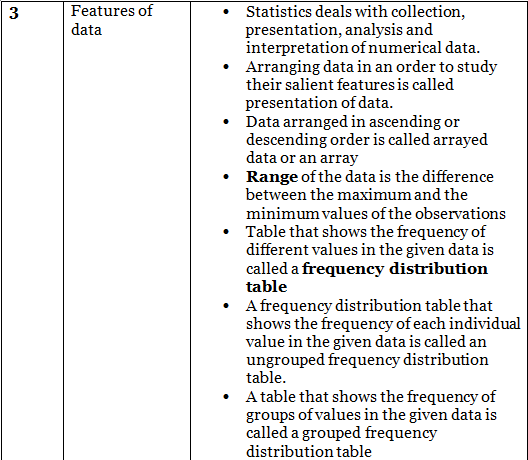
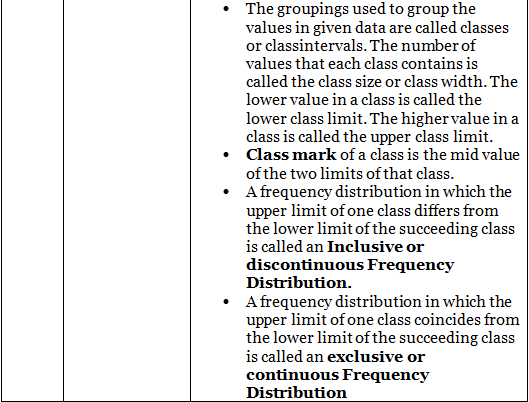
- Range=Maximum Value- Minimum Value
- Class Mark= Upper Limit+ Lower limit /2
- Mean of Raw data=

- Mean of Ungrouped data=
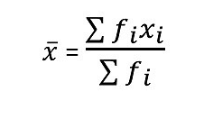
- Median when (n) is even=

- Median when (n) is odd=

- Mode of Raw Data= Element occurring maximum number of time
Important Definitions
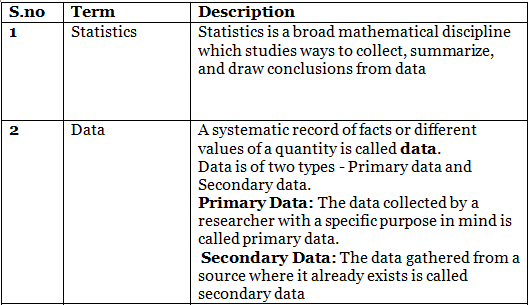
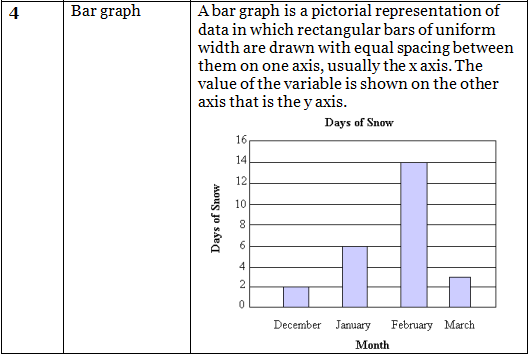
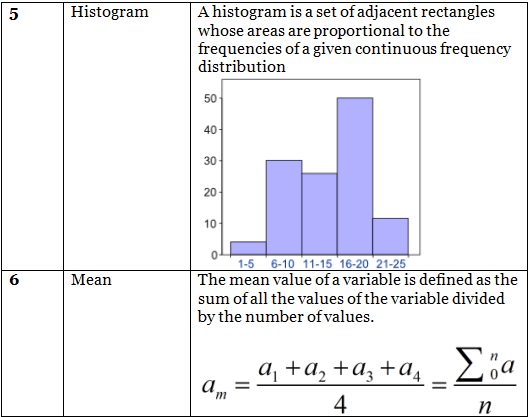
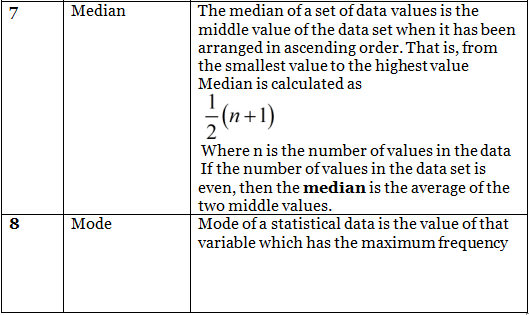
The document Important Formulas: Statistics | Mathematics (Maths) Class 9 is a part of the Class 9 Course Mathematics (Maths) Class 9.
All you need of Class 9 at this link: Class 9
|
40 videos|471 docs|57 tests
|
FAQs on Important Formulas: Statistics - Mathematics (Maths) Class 9
| 1. What are the key measures of central tendency in statistics? |  |
Ans. The key measures of central tendency in statistics are mean, median, and mode. Mean is the average of a set of numbers, median is the middle value when the numbers are arranged in ascending order, and mode is the value that appears most frequently.
| 2. How is variance calculated in statistics? |  |
Ans. Variance in statistics is calculated by finding the difference between each data point and the mean, squaring these differences, summing them up, and then dividing by the total number of data points.
| 3. What is the significance of standard deviation in statistics? |  |
Ans. Standard deviation in statistics measures the dispersion of data points from the mean. It helps in understanding the spread of data and how close or far data points are from the average.
| 4. How is correlation coefficient used in statistics? |  |
Ans. Correlation coefficient in statistics measures the strength and direction of a relationship between two variables. It ranges from -1 to 1, where -1 indicates a perfect negative correlation, 1 indicates a perfect positive correlation, and 0 indicates no correlation.
| 5. How can outliers affect statistical analysis? |  |
Ans. Outliers are data points that significantly differ from the rest of the data. They can skew results and affect measures of central tendency, such as the mean. It is important to identify and handle outliers appropriately in statistical analysis.
Related Searches


