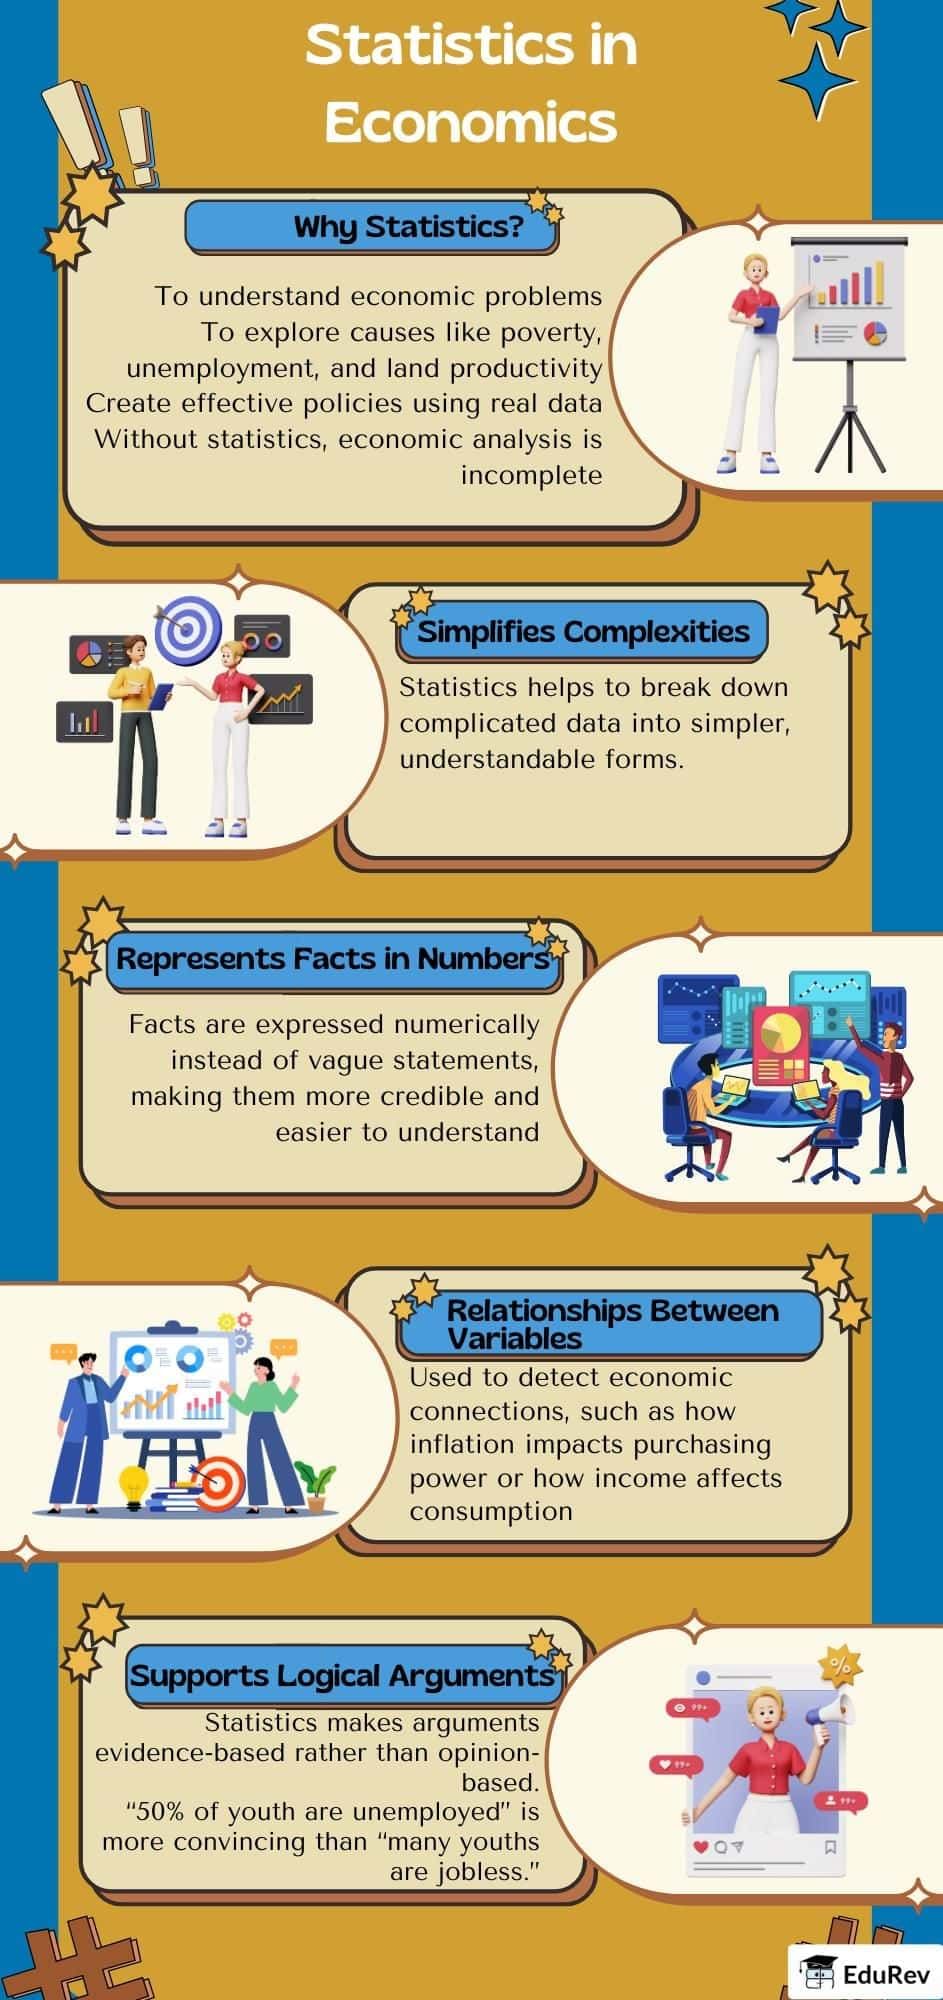
Commerce Exam > Commerce Notes > Economics Class 11 > Infographic: Statistics and Economics
Infographic: Statistics and Economics | Economics Class 11 - Commerce PDF Download

The document Infographic: Statistics and Economics | Economics Class 11 - Commerce is a part of the Commerce Course Economics Class 11.
All you need of Commerce at this link: Commerce
|
59 videos|222 docs|43 tests
|
FAQs on Infographic: Statistics and Economics - Economics Class 11 - Commerce
| $1. What are the key differences between statistics and economics in commerce? |  |
Ans. Statistics in commerce involves the collection, analysis, interpretation, and presentation of data to inform business decisions. Economics, on the other hand, focuses on the allocation of resources, production, and consumption within an economy. While statistics provides tools for data analysis, economics offers theoretical frameworks for understanding market behavior and economic policies.
| $2. How do statistics contribute to decision-making in business? |  |
Ans. Statistics provide businesses with vital insights through data analysis, helping them identify trends, forecast sales, and evaluate market conditions. By utilizing statistical methods, companies can make informed decisions regarding resource allocation, marketing strategies, and operational improvements, ultimately enhancing overall performance and competitiveness.
| $3. What is the significance of economic indicators in commerce? |  |
Ans. Economic indicators, such as GDP, unemployment rates, and inflation, are crucial for businesses as they reflect the overall health of an economy. These indicators help companies assess market conditions, anticipate consumer behavior, and adjust their strategies accordingly. Monitoring economic indicators enables businesses to make proactive decisions in response to changing economic environments.
| $4. How does understanding statistics improve market research outcomes? |  |
Ans. Understanding statistics enhances market research by enabling businesses to design effective surveys, analyze consumer preferences, and interpret results accurately. With statistical tools, companies can segment their target audience, measure satisfaction levels, and identify potential markets, leading to more tailored and successful marketing strategies.
| $5. What role does data visualization play in statistics and economics? |  |
Ans. Data visualization is essential in statistics and economics as it helps in presenting complex data in an understandable format. Graphs, charts, and infographics make it easier for stakeholders to grasp insights at a glance, facilitating better communication of findings and supporting data-driven decision-making processes in commerce.
Related Searches


