Revision Notes: Interpreting Information | Decision Making for UCAT PDF Download

Key Topics for Interpreting Information
Below are the core topics you need to understand and practice for Interpreting Information, with detailed explanations, strategies, and examples.
1. Understanding Data Formats
Interpreting Information questions present data in formats like text passages, tables, bar charts, line graphs, pie charts, or Venn diagrams. You must quickly comprehend the structure and purpose of the data to extract relevant information.
- Key Skills: Recognize data types (numerical, categorical, temporal), identify labels/units/legends, understand relationships (trends, comparisons).
- Relevance: Mirrors interpreting medical data (e.g., lab results, charts).
- Strategy: Skim data to understand structure; note labels and units.
Data: A table shows patient admissions for three conditions (Flu, Asthma, Diabetes) over 2021–2023:
| Year | Flu | Asthma | Diabetes |
|---|---|---|---|
| 2021 | 50 | 30 | 20 |
| 2022 | 60 | 35 | 25 |
| 2023 | 55 | 40 | 30 |
Answer: Flu (60 admissions).
Explanation: Compare the 2022 row: Flu (60), Asthma (35), Diabetes (25). Flu is highest.
Strategy: Skim the table to locate the 2022 row; compare values directly.
2. Extracting Relevant Information
You must pinpoint specific details from the data that address the question, ignoring irrelevant information.
- Key Skills: Filter extraneous data, match question to data points, avoid assumptions.
- Relevance: Doctors focus on relevant symptoms/test results.
- Strategy: Read question first, scan data for relevant details, use noteboard.
Data: A bar chart shows monthly rainfall (mm) in four cities (A, B, C, D) for 2023. June values: A (50), B (70), C (60), D (40).
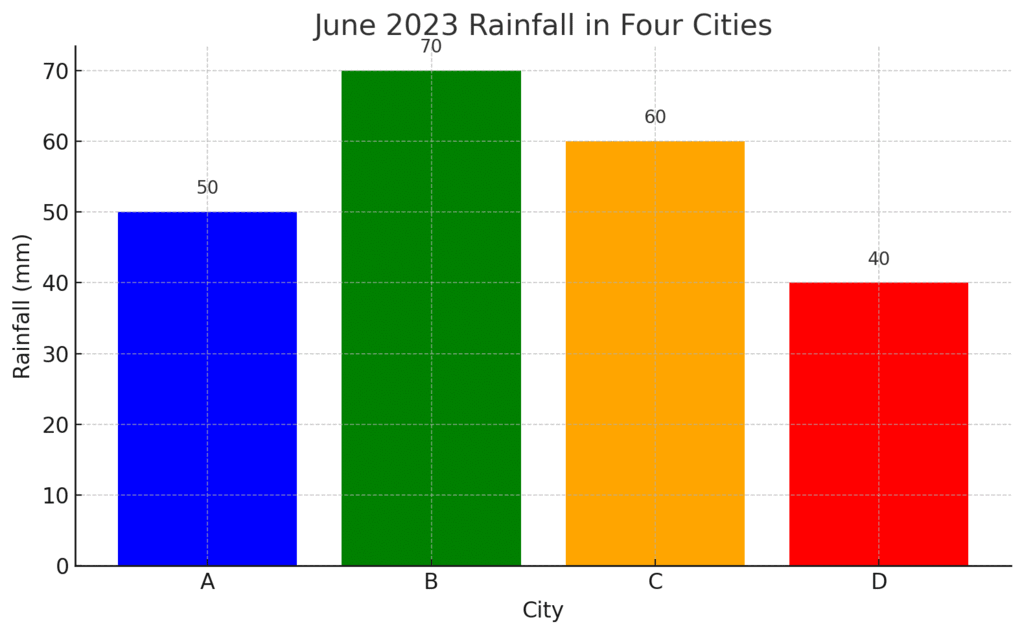 Question: Which city had the highest rainfall in June?
Answer: City B (70 mm).
Explanation: Locate June’s data and compare: B (70) is highest.
Strategy: Focus on June’s bars; ignore other months.
3. Analyzing Trends and Patterns
Identify trends (e.g., increasing/decreasing) or patterns (e.g., correlations, outliers) to draw conclusions.
- Key Skills: Spot trends, identify outliers, compare data across categories/periods.
- Relevance: Essential for tracking medical data (e.g., patient vitals).
- Strategy: Look for visual cues (e.g., slopes); calculate differences if needed.
Data: A line graph shows a company’s profits ($000s) from 2018–2023: 2018 (100), 2019 (120), 2020 (110), 2021 (150), 2022 (180), 2023 (200).
Question: In which year did profits increase the most compared to the previous year?
Answer: 2021.
Explanation: Calculate differences: 2019 (20), 2020 (-10), 2021 (40), 2022 (30), 2023 (20). 2021’s increase (40) is largest.
Strategy: Calculate year-on-year changes; use calculator for accuracy.
4. Making Calculations from Data
Perform basic calculations (percentages, ratios, averages) to interpret data.
- Key Skills: Use UCAT calculator, calculate proportions/percentages, verify results.
- Relevance: Doctors calculate dosages or interpret stats.
- Strategy: Practice mental math; use calculator for complex numbers.
Data: A clinic has 60 male and 40 female patients.
Question: What percentage of patients are female?
Answer: 40%.
Explanation: Total patients = 60 + 40 = 100. Female percentage = (40 / 100) × 100 = 40%.
Strategy: Use calculator to confirm; write steps on noteboard.
5. Drawing Logical Conclusions
Use data to determine if a statement is true, false, or cannot be determined.
- Key Skills: Evaluate data support, avoid extrapolation, identify correlations.
- Relevance: Critical for evidence-based medical decisions.
- Strategy: Stick to data; check explicit support for statements.
Data: A pie chart shows smartphone market shares: Brand A (40%), B (30%), C (20%), D (10%).
Question: Is Brand A’s market share larger than Brand B’s?
Answer: True.
Explanation: Compare: A (40%) > B (30%).
Strategy: Verify data supports the statement; avoid assumptions.
Data: Same pie chart.
Question: Does Brand A sell the most phones globally?
Answer: Cannot be determined.
Explanation: The chart shows market share, not global sales volume.
Strategy: Recognize when data is insufficient.
6. Handling Complex or Multi-Step Questions
Some questions involve multiple data sources or steps.
- Key Skills: Integrate data, break down steps, manage time.
- Relevance: Doctors synthesize multiple data sources (e.g., history, tests).
- Strategy: Address each part systematically; use noteboard.
Data: A table shows employee salaries ($): A (50,000), B (60,000), C (45,000), D (70,000). Text states: “Employees earning over $55,000 get a bonus.”
Question: How many employees qualify for a bonus?
Answer: 2.
Explanation: Compare salaries to $55,000: B (60,000) and D (70,000) qualify.
Strategy: Combine text and table data; list qualifying employees.
7. Avoiding Common Mistakes
Avoid traps like misreading data, overlooking units, or assuming extra information.
- Key Skills: Check labels/units, recognize distractors, manage time.
- Relevance: Precision prevents medical errors.
- Strategy: Double-check units; eliminate incorrect options.
Data: A graph shows temperatures (°C): Jan (10), Feb (12), Mar (15).
Question: What is the temperature in February?
Answer: 12°C.
Explanation: Misreading as Fahrenheit leads to errors; confirm units.
Strategy: Note units (°C); review for careless errors.
8. Practical Application and Time Management
Apply skills under timed conditions (29 questions, 31 minutes; ~1 min/question).
- Key Skills: Systematic approach, balance speed/accuracy, simulate exam.
- Relevance: Time management is key in medical settings.
- Strategy: Start untimed, then practice timed; use mock tests.
Data: A table shows sales ($000s) by region: North (50, 60, 70), South (40, 45, 50), East (30, 35, 40) for 2021–2023.
Question: Which region had the highest sales in 2023?
Answer: North (70).
Explanation: Compare 2023 column: North (70), South (50), East (40).
Strategy: Skim for 2023; practice timed to improve speed.
Summary
The Interpreting Information topic requires you to:
- Understand data formats (text, graphs, tables).
- Extract relevant details efficiently.
- Analyze trends and patterns.
- Perform accurate calculations.
- Draw logical conclusions without assumptions.
- Handle complex, multi-step questions.
- Avoid traps like misreading data.
- Apply skills under timed conditions.
Additional Tips for UCAT Success
- Build a Routine: Practice daily with diverse data types.
- Simulate Conditions: Use UCAT’s calculator and noteboard.
- Track Progress: Log scores; review weak areas.
- Stay Calm: Build confidence through practice.
|
16 videos|21 docs|27 tests
|
FAQs on Revision Notes: Interpreting Information - Decision Making for UCAT
| 1. What is the UCAT and why is it important for medical school admissions? |  |
| 2. How can I effectively interpret information for the Decision Making section of the UCAT? | |
| 3. What types of questions can I expect in the Decision Making section of the UCAT? | |
| 4. Are there any strategies to improve my performance in the UCAT Decision Making section? | |
| 5. How can I manage my time effectively during the UCAT Decision Making section? | |


Sample Paper
,Important questions
,study material
,practice quizzes
,Summary
,past year papers
,MCQs
,Previous Year Questions with Solutions
,Extra Questions
,Free
,Revision Notes: Interpreting Information | Decision Making for UCAT
,video lectures
,Exam
,Objective type Questions
,Revision Notes: Interpreting Information | Decision Making for UCAT
,Semester Notes
,shortcuts and tricks
,ppt
,Viva Questions
,Revision Notes: Interpreting Information | Decision Making for UCAT
,mock tests for examination
,


Revision Notes: Interpreting Information Free PDF Download
Importance of Revision Notes: Interpreting Information
Revision Notes: Interpreting Information
Revision Notes: Interpreting Information UCAT Questions
Study Revision Notes: Interpreting Information on the App
|
© EduRev
|
Education Revolution
|


|


