Introduction & Examples: Pie Charts | Logical Reasoning (LR) and Data Interpretation (DI) - CAT PDF Download
| Table of contents |

|
| What are Pie Charts? |

|
| Concepts of Pie Chart |

|
| How to Create a Pie Chart |

|
| Tips to Solve Pie Chart Questions |

|
| Solved Examples |

|
What are Pie Charts?
Pie Charts are the circular way of data representation. In these graphs, a circle is divided into various segments and each single segment denote a category from the given data.
- In a pie chart, the arc length of each slice (and consequently its central angle and area), is proportional to the quantity it represents. Pie graphs use percentages or angles to show the relative sizes of various categories.
- They are a visual way of displaying data that might otherwise be given in a small table.
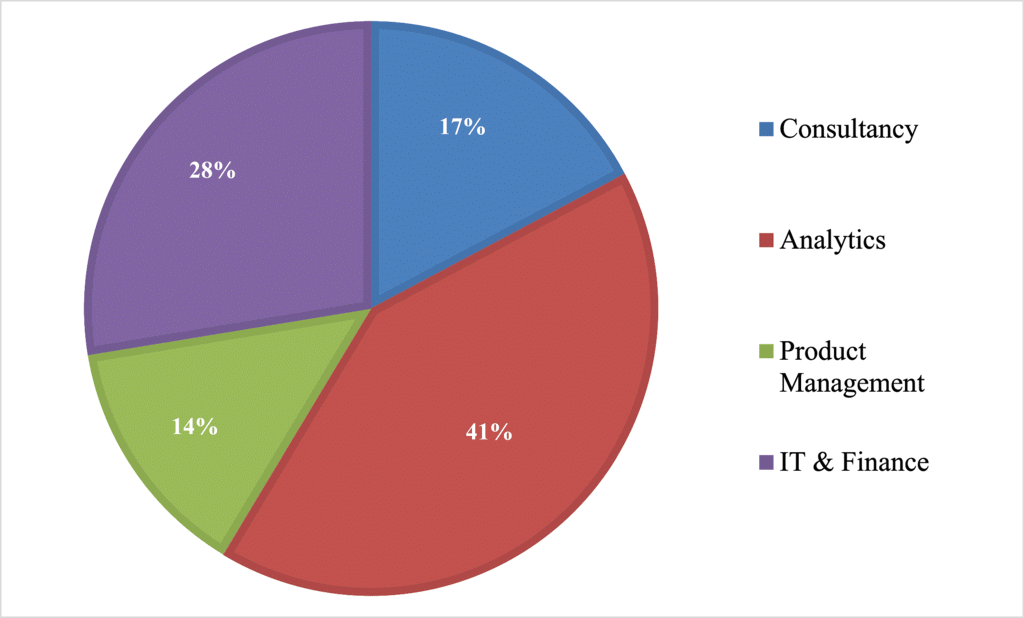
- Pie charts are useful for displaying data that is classified into nominal or ordinal categories.
Nominal data is categorized according to descriptive or qualitative information such as county of birth or type of pet owned.
Ordinal data is similar but the different categories can also be ranked, for example in a survey people may be asked to say whether they classed something as very poor, poor, fair, good, or very good. - They are generally used to show percentage or proportional data and usually, the percentage represented by each category is provided next to the corresponding slice of pie.
- They are good for displaying data for around 6 categories or fewer. When there are more categories it is difficult for the eye to distinguish between the relative sizes of the different sectors and so the chart becomes difficult to interpret.
There are various kinds of pie graphs namely, 3D pie chart, doughnut chart, exploded pie chart, ring chart, etc. But in the exam, we will usually be given the basic pie chart which is given below.
Example: The chart below shows the distribution of the sales of the car industry between six car companies. Looking at the chart below, we can infer that Maruti accounts for 24 percent of the market share, while GM accounts for 35 percent of the market share, Ford for4 percent of the market share, Tata for 10 percent of the market share, Hyundai for 15 percent of the market share and Fiat for 12 percent of the market share.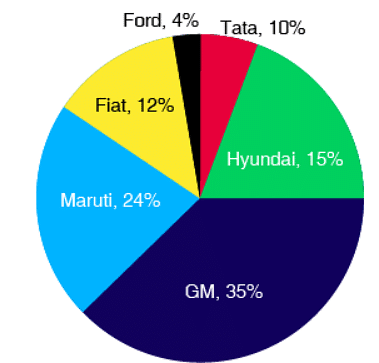 Distribution of cars sales between six companies
- The pie chart encompasses a circle of 360 degrees which represents 100 percent of the value of the continuous variable. Thus, 3.6 degrees on the pie chart represent 1 percent of the total value of the continuous variable being represented.
- A single pie diagram can represent only one continuous variable. Hence, in terms of versatility of data representation, pie charts are less versatile than either bar charts, x-y graphs, or tables.
Uses of a Pie Chart
- In case you want the audience to have an understanding of the parts concerning the whole unit of data.
- To convey a segment of data and its size.
- It is very helpful in the presentation of data in a systematic manner to be understandable by common people as well.
Concepts of Pie Chart
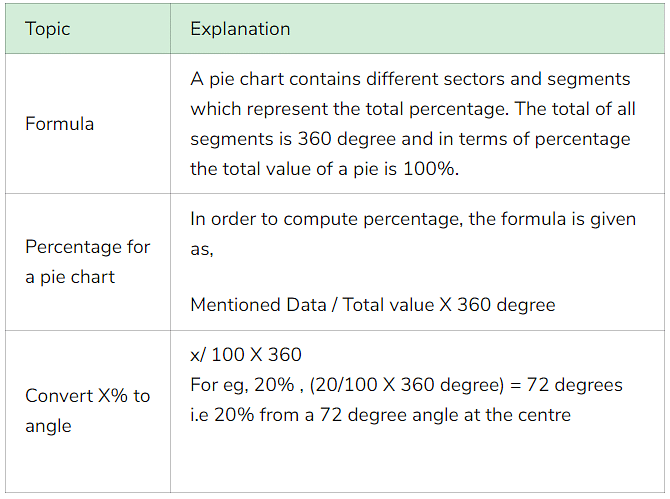
To calculate the percentage of each segment: Each value by the total and multiply by 100 to get a per cent
How to Create a Pie Chart
To create a pie chart, you must know the numerical distribution of the categories to be included in the pie chart. Once you have all the categories and their corresponding data, then follow the given steps to create a pie chart. All the slices of the pie chart make up 360 degrees and all the data when combined make up 100 percent.
We can create a pie chart by following the below steps:
- Step 1: Distribute the data according to their categories.
- Step 2: Calculate the total.
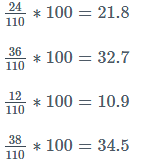
- Step 3: Convert the data into percentages by dividing the numerical value of each category with the total calculated in Step 2 and multiplying by 100.
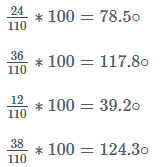
- Step 4: Calculate the degrees of each category by dividing the numerical value of each category with the total calculated in Step 2 and multiplying by 360.
- Step 5: Draw a circle and using a protractor, draw the pie chart according to the degrees calculated for each category in Step 4.
Example: Let us consider the following example to understand all these steps.
Runs scored by 4 batsmen in a cricket match are:
- Step 1: This step is done with this table.
- Step 2: Calculating the total 24+36+12+38=110
- Step 3: Calculate individual percentages.
- Step 4: Calculate individual degrees.
- Step 5: According to the degrees calculated, draw a pie diagram using a protractor and mention the percentage of runs scored by each player along with their name.
Tips to Solve Pie Chart Questions
- You can solve Pie chart-based problems by understanding circle properties and learning about the basic concept of percentage.
- A 360 degree corresponds to 100 per cent.
- To work on a pie chart, consider the size of the angle, i.e. degrees, the value of the slice and the total sum of values in a slice.
- Round off to the nearest whole number, fractional equivalent or per cent to ensure the equation is easy to solve
Solved Examples
Example 1: The following pie chart shows the amount of subscriptions generated for Indian Bonds from different categories of Investors.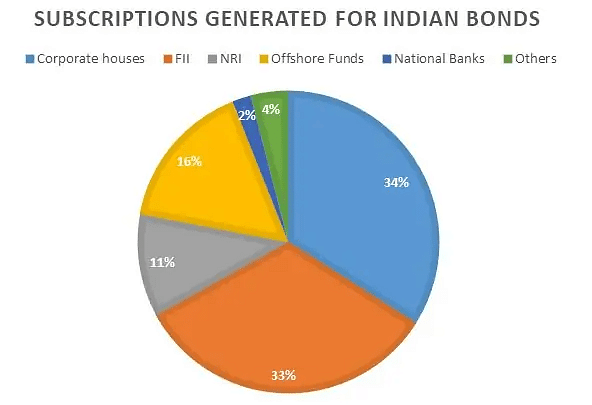
(i) If the investment by NRI’s are INR 4,000 crore, then investment by both corporate houses and FII’s together is:
(a) 24000 crores
(b) 24363 crores
(c) 25423.4 crores
(d) 25643.3 crores
Sol: Option (b)
Explanation: If the investment by NRI is worth 4000 crores which are 11% of the total value.
Then, the total value will be = 4000 * 100/11 = 36363.63
Now, investment by corporate houses and FII’s together = 67% of 36363.63 = 24,363.63 crore.
(ii) What percentage of total investment is coming from either FII’s or NRI’s?
(a) 33%
(b) 44%
(c) 11%
(d) 22%
Sol: Option (b)
Explanation: Investment from FII = 33% and Invest from NRI = 11%
Thus, total investment coming from FII's or NRI's = 44%
(iii) What is the approximate ratio of investment flows into India Bonds from NRI’s to corporate houses?
(a) 1:4
(b) 1:3
(c) 3:1
(d) Cannot be determined
Sol: Option (b)
Explanation: The investment by NRI’s is 11% and the corporate house is 34%.
Therefore, the ratio will be 11:34 ≈ 1:3.
(iv) If the total investment flows from FII were to be doubled in the next year and the investment flows from all other sources had remained constant at their existing levels for this year, then what would be the proportion of FII investment in the total investment flows into Indian Bonds in the next year (approximately)?
(a) 40%
(b) 50%
(c) 60%
(d) 70%
Sol: Option (b)
Explanation: The current FII’s are 33% and it will double next year making it 66%.
Thus, keeping other investments constant now the total becomes 133.
Hence, 66 % of 133 will be 49.62% i.e. 50%.
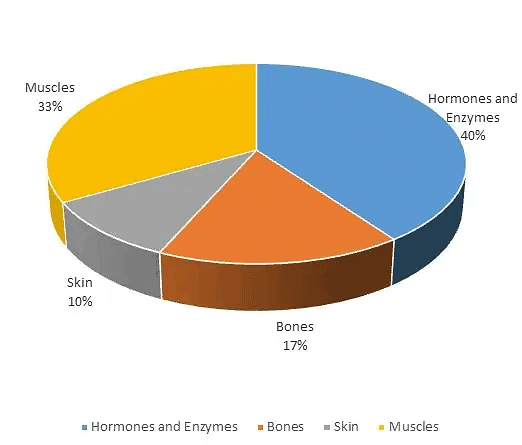
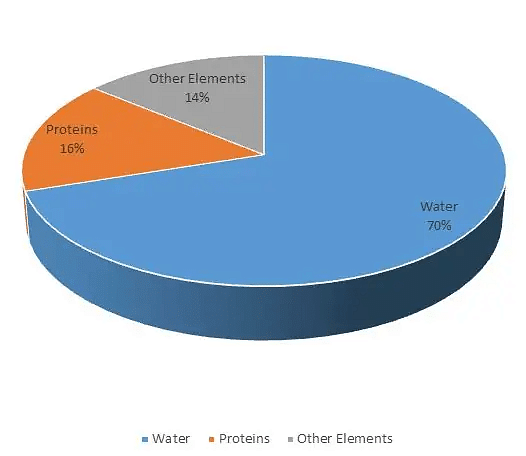
Example 2: Study the following diagram carefully and answer the questions:
Percentage Composition of Human Body
(i) What percent of the total weight of human body is equivalent to the weight of the proteins in skin in human body?
(a) 0.016
(b) 1.6
(c) 0.16
(d) Cannot be determined
Sol: Option B
Explanation: Now to solve this question you have to make use of both the pie charts. Since total percentage of protein in body is 16%. And, the total percentage of the weight of skin in human body is 10%. Therefore, the percentage of protein in skin is 10% of 16.i.e. 1.6.
(ii) What will be the quantity of water in the body of a person weighing 50 kg?
(a) 20 kg
(b) 35 kg
(c) 41 kg
(d) 5 kg
Sol: Option B
Explanation: Water constitutes 70% of the body. Thus, if the man weighs 50 kg then 70% of it will be water. The weight of water will be 35 kgs.
(iii) What is the ratio of the distribution of proteins in the muscles to that of the distribution of proteins in the bones?
(a) 1:18
(b) 1:2
(c) 2:1
(d) 18:1
Sol: Option C
Explanation:
Again, using both pie charts we know that 33% of body weight is constituted in muscles whereas 17% in bones and 16% of it will be protein.
(iv) To show the distribution of proteins and the other dry elements in the human body, the arc of the circle should subtend at the center an angle of;
(a) 54o
(b) 126o
(c) 108o
(d) 252o
Sol: Option C
Explanation:Using the formula given in the example 1, Ans 5 we get,
[(16% + 14%)/100] * 360 = 108.
(v) In the human body, what part is made of neither bones nor skin?
(a) 1/40
(b) 3/80
(c) 2/5
(d) None of these
Sol: Option D
Explanation: Now let us consider the body to be- numeraire as 1 and 17/100 and 10/100 constitutes bones and skin respectively i.e. 1/6 and 1/10. Hence, the required answer is 1 – (1/6 +1/10) = 11/15.
|
88 videos|119 docs|91 tests
|
FAQs on Introduction & Examples: Pie Charts - Logical Reasoning (LR) and Data Interpretation (DI) - CAT
| 1. What is a pie chart and what are its main components? |  |
| 2. How do you create a pie chart from a data set? |  |
| 3. What are some common mistakes to avoid when interpreting pie charts? |  |
| 4. How can pie charts be useful in bank exams? |  |
| 5. What tips can help solve pie chart questions effectively in exams? |  |
|
88 videos|119 docs|91 tests
|

|
Explore Courses for CAT exam
|

|
