Introduction to Graphs Class 8 Worksheet Maths Chapter 13
Multiple Choice Questions
Q1: In which quadrant does the point s(−3,2) lie?
(a) II
(b) I
(c) III
(d) IV
Q2: On which axis does the point (0,−6) lie
(a) x− axis
(b) y− axis
(c) origin
(d) None of these
Q3: Perpendicular distance of the point (2,3) from x− axis is
(a) 2
(b) 3
(c) 0
(d) None of these
Q4: The co-ordinates of origin is
(a) (x,0)
(b) (0,y)
(c) (0,0)
(d) None of these
Answer the following questions
Q1: The point where x− axis and y− axis meet is called __________?
Q2: A pictorial representation of data in the form of rectangular bars to show comparison among categories is called __________?
Q3: What is a pie graph?
Q4: Find the co-ordinates of the points A, B, C, D from the graph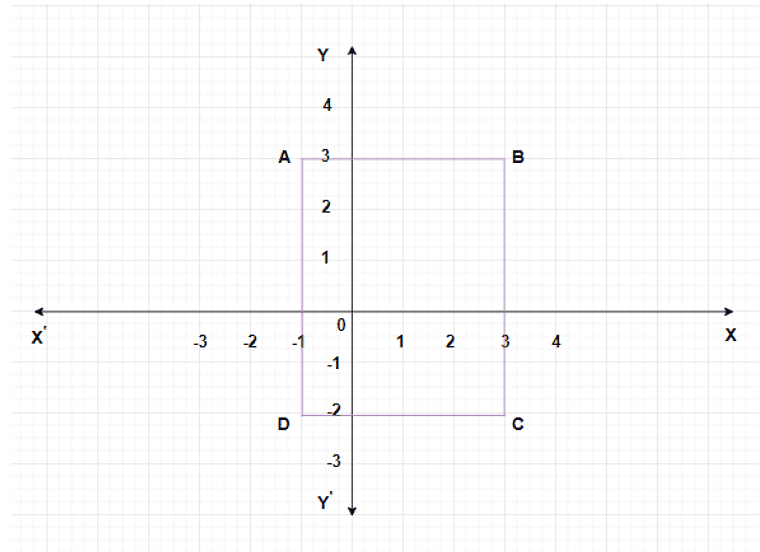 Q5: If a man moves 6 units right due (east) from point A, then find the co-ordinates of his new position.
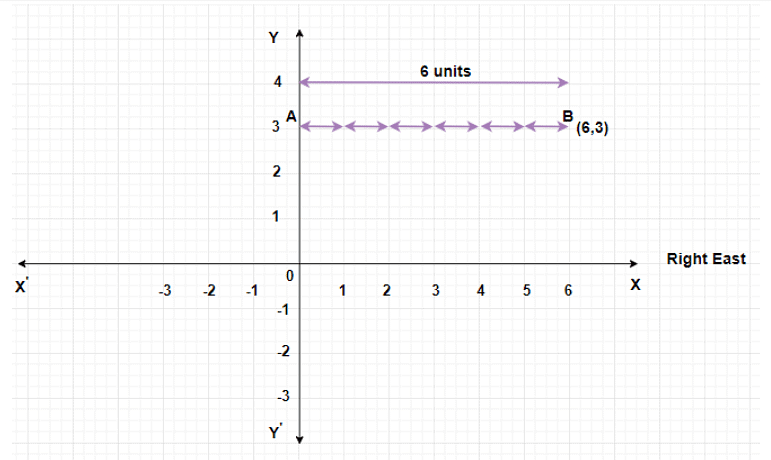
Q6: In a class of 40 students, the marks obtained in maths subject (out of 50) are as given below Draw histogram.
Q7: Find the time taken by a body to cover 30 meters. Hence find speed?
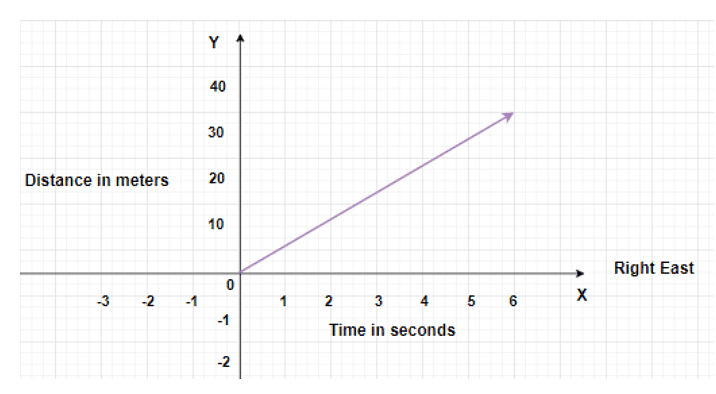
Q8: Plot the following points. Verify if they lie on a line? (1,3), (2,3), (3,3), (4,3)
Q9: Draw a line passing through (3,1) and (1,3). Find the co-ordinates of the points at which this line meets the x− axis and y− axis.
Q10: Following graph gives the movement of a car from a town A to town D. Study the graph and answer the following questions:
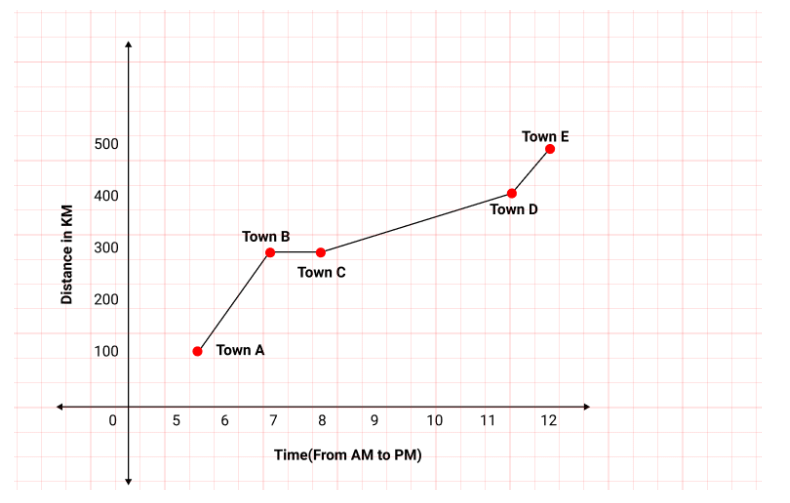
(a) What is the distance between town A and town D ?
(b) At what time did car start from town A?
(c) Where did the car stop and for what duration?
Q11: Plot the points A(4,0) and B(0,3) on the graph. Also find the length of hypotenuse of triangle AOB
Q12: Make a table of values for the function y=4x, From the table find the value's of y when x=4 and x=5
Q13: From the given graph, compute the difference between the sales of 2013 and 2015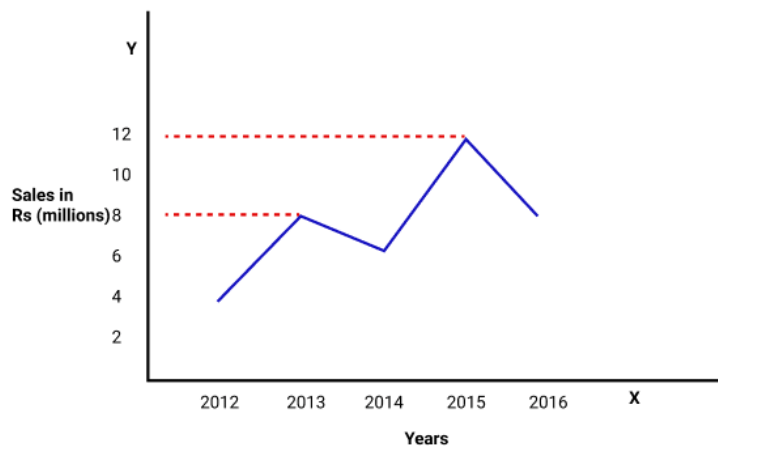 In which year sales are high?
Q14: Draw the histogram to represent the following data and define linear graph.
Q15: Plot the points A(2,3), B(5,3), C(5,5) and D(2,5) on graph. Connect the points in that order. So as to get a closed figure ABCD . What type of figure do you get?
Q16: Reena deposited Rs12,000 in a bank at the rate of 10% per annum. Draw a linear graph showing the relationship between the time and simple interest. Also find the simple interest for 4 years.
Q17: Hundred students from a certain locality use different modes of travelling to school as given below. Draw a bar graph which is maximum mode of travel?
You can access the solutions to this worksheet here.
|
81 videos|423 docs|31 tests
|
FAQs on Introduction to Graphs Class 8 Worksheet Maths Chapter 13
| 1. What are the different types of graphs used in data representation? |  |
| 2. How do you choose the right type of graph for your data? |  |
| 3. What are the key components of a graph? |  |
| 4. How can I accurately interpret data from a graph? |  |
| 5. What are common mistakes to avoid when creating graphs? |  |


