Introduction to Index Numbers, Business Mathematics and Statistics | SSC CGL Tier 2 - Study Material, Online Tests, Previous Year PDF Download
Introduction
Index numbers are tools used to assess variations in the magnitude of a collection of interrelated variables across different periods. These variations may pertain to aspects such as the prices of goods, the actual quantity of goods produced, sold, or consumed, or even more abstract concepts like intelligence, attractiveness, or efficiency.
Such comparisons can span across different time periods, locations, or similar categories—such as individuals, institutions, or entities. Therefore, index numbers may be used to compare the cost of living across time or between various regions or countries, the physical output of different manufacturing units, or the performance level of multiple educational systems.
An index number serves as a comprehensive indicator of the relative shift occurring in a group of items that are believed to be connected. For instance, a price index seeks to evaluate a defined assortment of goods and services—referred to as a market basket—by considering the prices of each item in that basket at two distinct times, the significance or weight of each item, and then compiling all of this data in a way that the overall variation in prices for the entire basket is conveyed through a single representative figure.
Definition of an index number
Index numbers are statistical instruments created to assess the relative variation in the magnitude of a particular phenomenon across different periods, geographical regions, or other distinguishing features. These phenomena may include aspects such as income levels, production output, and more. Studying these changes is highly significant for comprehending the state of the economy, formulating government policies, and determining wage levels, among other applications. In essence, an index number acts as an economic barometer, offering a quantitative reflection of the economic pressures experienced by consumers—either directly or indirectly.
John I. Griffin has describes it as “An index number is a quantity which by reference to a base period, shows by its variation, the changes in the magnitude over a period of time.”
Index numbers are the numbers which express the value of a variable at any time (current period) as a percentage of the value of that variable at some reference period or base period.
Edge worth gave the definition of index numbers as- “Index Number shows by its variation the changes in a magnitude which is not susceptible of either accurate measurement in itself or of direct variation in practice”.
Construction of an index number
The methods used for constructing index numbers focus on how to combine time series data that cannot be directly added due to their being measured in non-comparable units.
For instance, the annual wheat output can be determined by summing the individual contributions of producers or the total quantity traded in markets. Despite possible differences in wheat grades—as is common with many commodities—all varieties of wheat are sufficiently similar to allow total output to serve as a meaningful measure. Generally, items that belong to the same category can be combined if they are recorded using the same units of measurement.
However, many instances arise where there is a need to assess combined changes in the production of multiple commodities that are not measured in the same units and therefore cannot be added together to form a total. For example, the overall output of manufactured goods cannot be determined by summing the quantities of various items, since there is no universal physical unit to represent all goods. Furthermore, if the physical quantities of items cannot be aggregated, averaging their prices would also be inappropriate. Therefore, to determine changes in the general price level, index number construction techniques must be applied.
The central principle in all index number methods is to average the relative changes in either quantity or price, as these relative changes (expressed as percentages or ratios) are comparable and can be combined—even when the underlying data cannot be added together. For example, it would not be correct to add tons of wheat and tons of cotton, but if wheat production rose to 110% and cotton production to 106% of their respective values in the previous year, these percentages can be averaged. The result, 108%, would represent the average production change—assuming both commodities are equally significant. However, if cotton is six times more important than wheat, the calculation should reflect this by assigning weights of 6 and 1 to the respective percentages. This type of weighted average of relative changes forms what is known as an index number.
Another distinguishing characteristic, of all index numbers is that they are expressed relative to some specified place, time or period called the base.
When data can be added and the single series reduced to a fixed base series of relatives, the relatives are called index numbers by some statisticians, others reserve the term 'index number' exclusively for an average of relatives derived from series that cannot properly be added. Since many relatives based on a single series are widely used as measures of business conditions, it seems simple to use the term index number to describe both simple relatives and average of relatives.
Price Relatives
One of the simplest examples of an index number is a price relative, which is the ratio of the price of a single commodity in a given period to its price in another period called the base period or reference period. Here we assume prices to be constant for any one period. If they are not, an appropriate average for the same can be taken to make this assumption valid.
If p₀ and pᵢ denote the commodity prices during the base period and given period respectively, then by definition:
P₀ᵢ = pᵢ / p₀
It is generally expressed as a percentage by multiplying by 100:
Price Relative = (pᵢ / p₀) × 100
More generally, if pᵢ and pⱼ are prices of a commodity during periods i and j respectively, the price relative in period j with respect to period i is defined as:
Pⱼᵢ = pⱼ / pᵢ
Properties of Price Relatives
If pᵢ, pⱼ, pₖ denote prices in periods i, j, k respectively, the following properties exist for the associated price relatives:
1. Identity Property
Pᵢᵢ = 1
Pᵢᵢ = pᵢ / pᵢ = 1 or 100%
This states that the price relative for a given period with respect to the same period is 1 or 100%.
2. Time Reversal Property
Pᵢⱼ × Pⱼᵢ = 1 or Pᵢⱼ = 1 / Pⱼᵢ
Pᵢⱼ × Pⱼᵢ = (pⱼ / pᵢ) × (pᵢ / pⱼ) = 1
This states that if two periods are interchanged, the corresponding price relatives are reciprocals of each other. So price relatives follow time reversal property.
3. Cyclical or Circular Property
According to this:
Pⱼₖ × Pₖᵢ × Pᵢⱼ = 1
As:
Pⱼₖ × Pₖᵢ = Pᵢ/Pⱼ × Pⱼ/Pₖ × Pₖ/Pᵢ = 1
Modified Cyclical or Circular Property
Pⱼₖ × Pᵢⱼ = Pᵢₖ
Quantity or volume relatives
Instead of comparing prices of a commodity, we may be interested in comparing quantities or volumes of the commodity, such as quantity or volume of production, consumption, exports, etc. In such cases we speak of quantity relatives or volume relatives. For simplicity, as in the case of prices, we assume that quantities are constant for any period. If they are not, an appropriate average for the period can be taken to make this assumption valid.
If q0 denotes the quantity or volume o f a commodity produced, consumed, exported, etc., during a base period, while qi denotes the corresponding quant it y produced, consumed, etc., during a given period, we define Quantity or volume relative = qi/qo which is generally expressed as a percentage.
As in the case of price relat ives, we use the notation qij to denote the quantity relative in period j with respect to period i. The same remarks and properties pertaining to price relatives are applicable to quantity relatives.

Value relatives
If p is the price of a commodity during a period and q is the quantity or volume produced, sold, etc., during the period, then pq is called the total value. Thus if 1000 items are sold at 30 Rs. each, the total value is Rs 30 × 1000 = Rs 30,000.
If p₀ and q₀ denote the price and quantity of a commodity during a base period while pᵢ and qᵢ denote the corresponding price and quantity during a given period, the total values during these periods are given by v₀ and vᵢ respectively, and we define:
Value relative = vᵢ/v₀ = pᵢqᵢ/p₀q₀ = (pᵢ/p₀) (qᵢ/q₀)
= price relative × quantity relative
The same remarks, notation, and properties pertaining to price and quantity relatives can be applied to value relatives.
In particular, if pⱼᵢ, qⱼᵢ, and vⱼᵢ denote the price, quantity, and value relatives of period j with respect to period i, then we have:
vⱼᵢ = pⱼᵢ qⱼᵢ
Link and chain relatives
At times, it may be preferable to represent an index number not as a percentage relative to a fixed or reference base year, but rather as a percentage in comparison to the immediately preceding period.
An index of this kind can make use of various formulas, incorporating weights that correspond to either or both of the periods (years or months) being compared. Often, these individual percentages are linked back to the original base period through a method involving successive multiplication of the period-to-period indices. This method of linking relative changes over time forms what is referred to as a Chain Index.
Chain base method or chain relative method consists in calculating a series of index numbers for each year with the preceding year as base, viz, P01, P12, P23......... where Pij represents the price index with i as base year and j as given year. These are known as link indexes (relatives). The basic index number is obtained by the successive multiplication of the link indexes (relatives).
Po₁ = first link
Po₂ = Po₁ × P₁₂
Po₃ = Po₁ × P₁₂ × P₂₃ = Po₂ × P₂₃
Utility of chain indexes
Over a number of years, various changes take place commodities shift considerably in their relative importances. Old commodities disappeared from scene are succeeded by new commodities models, styles. Grades of a commodity become obsolete and cease to be manufactured with new models, styles or grades taking their place; marketing centers shift, so that a price quotation at the new center must replace that at the old. Again, it rarely happens that comparable data are available for long periods; thus, the chain index is an extremely valuable tool.
(1) commodit ies may readily be dropped, if they are no longer relevant;
(2) new commodities may be introduced and
(3) weights may be changed.
Thus, account may readily be taken of basic changes in production, distribution, and consumption habits with the use of chain indexes.
The disadvantage of the chain index is that, while the percentage of previous year figures gives accurate comparisons of year to year changes, the long range comparisons of the chained percentages are not strict ly valid. However, when the index number user wishes to make year to year comparisons, as is so often done by the businessman, the percentages of the preceding year provide a flexible and useful tool.
Problems involved in computation of Price Index Number
The problems which the statistician encounters in index-number construction are:-
- Definition-of the purpose for which the index is being compiled.
- Selection of data for inclusion in index.
- Selection of sources of data.
- Collection of data.
- Selection of base.
- Method of combining data.
- System of weighting.
Not all of the seven problems listed above are of equal importance, nor are they always independent of one another. Thus, a simple system of weighting would require a different list of commodities for a price index than would a method that employs a separate weighting system for each subgroup of an index. Likewise, the weighting system to be used depends upon the method of combining the data. Let us discuss all in detail.
Definition-of the purpose for which the index is being compiled.
Prior to collecting data and performing any computations, it is essential to clearly define what is intended to be measured and how the results will be used. An index number that is appropriately created for its intended objective becomes a highly effective and efficient tool. However, if the compilation and structure are incorrect, the index may prove misleading. For example, if the aim is to track fluctuations in the cost of building private homes, collecting prices for heavy structural steel is not suitable. Similarly, if we want to assess changes in family clothing expenses, obtaining prices for cotton in bulk would be irrelevant. Likewise, when analyzing retail trade trends, we should rely on department store sales data instead of figures from wholesalers or manufacturing units.Selection of data for inclusion in index.
While the technique for integrating variables holds significance in constructing index numbers, it pales in comparison to the challenge of choosing the data that will serve as the foundation for the index. This point cannot be emphasized strongly enough. The data selected must be precise and uniform in nature; furthermore, the sample must accurately represent the population as a whole. A sample cannot be deemed representative unless it includes a sufficient quantity of items. Stated differently, the reliability of index numbers depends on selecting a large enough sample of relevant elements.
As highlighted earlier, the choice of commodities for a price index, and the type of price data used, must correspond directly with the subject being measured. For instance, a wholesale price index should be built using wholesale price data. On the other hand, when compiling an index of consumer expenditures, it is necessary to consider not only the retail prices of food items but also expenses such as housing rents, utility rates for electricity and gas, clothing prices, transportation costs, healthcare expenses, and other relevant categories for the population whose cost of living is being evaluated.
Selection of sources of data.
When identifying data sources for index numbers, one can either rely on periodically published market prices or acquire periodic custom reports from merchants, manufacturers, exporters, or other stakeholders who possess the essential data. Regardless of the approach, it is imperative to ensure that the data precisely corresponds to the subject under evaluation. For example, if the goal is to measure changes in retail food prices, the data should come from supermarkets, chain retailers, local independent outlets, and other significant vendors. These various data sources should not be combined haphazardly, but should be assigned suitable weights before aggregation. Additionally, quotations gathered at different times of the month—such as the beginning, middle, or end—should typically not be blended into a single index without careful treatment.Collection of data.
Most index numbers rely on samples rather than complete population data.
This, along with the fact that selecting the appropriate data is critical in constructing index numbers, makes it necessary to keep the following points in mind:
(i) Accuracy: Statistical figures that appear in neatly printed format should not be assumed to be accurate by default. In this context, it is important to note that primary source data is, in general, more reliable than data obtained from secondary sources. Therefore, it becomes the responsibility of the statistician to understand the methods by which the data were gathered and to make a careful and informed choice regarding the source of data.
(ii) Comparability Across Time and Location: When information is collected from more than one source, the trustworthiness of each individual source must be assessed. Moreover, it is essential that the user ensures the data obtained from these multiple sources is consistent and comparable across both time and space.Selection of base.
Regardless of which method is used for applying weights or for combining data, it is a common (though not mandatory) practice to designate a certain time period as the reference point or base, assigning it a value of 100 percent, against which other index numbers are compared. Generally, one month is considered too short to be selected as the base period, as any individual month might be atypical due to seasonal fluctuations or unexpected events. Sometimes, a full year is used for this purpose. However, even a single year may not always be adequately “normal” to serve as a proper standard of comparison. Economic conditions and price levels tend to fluctuate continuously as they follow the natural rhythm of business cycles.
For example comparisons of wage increases with cost of living increases depend heavily on the period selected as the base for the index. It is to be expected that, for a base year in labour management wage negotiat ions, labour union leaders would select a year when employees were relatively well paid. Representatives of management would select the year before the major wage concession. It is not surprising that both sides would prepare their own indexes and that they would arrive at widely varying conclusions. The selection of the base year can have a significant impact on the sympathy of Government and the general public toward the demands or posit ions of the two parties to the negotiations.
For these various reasons, the base periods for most indexes have been changed from time to time. As a general rule, and with notable exceptions, the base is no more than about ten to fifteen years prior to the current date. It is quite common for the base to be a single year, but many indexes have a three to five year period average as their base as an attempt to get a more normal period. Major changes in an index, such as the updating of the base, are accompanied by a recalculation of old index numbers to express them relative to the new base, and often by changes in the commodities and the quantity weights. Index numbers covering a period of many years are, at best only reasonably good estimates of relative prices. (6) Method of combining Data There are two methods of constructing index numbers:Method of combining Data
There exist two primary techniques for the construction of index numbers:
(1) through the computation of aggregate values and (2) by taking the average of relatives. Each of these fundamental approaches can further be categorized as either simple (unweighted) or as having specific weights assigned. Even though only the specifically weighted approaches are logically justified, the simple unweighted methods are typically introduced because they are occasionally used and because their presentation naturally leads to a discussion of the problems and implications associated with different systems of weighting.
The aggregative approach provides results in a direct manner and offers an outcome that is straightforward and easy to interpret. In contrast, the method using relatives is more indirect and yields a result that is more technically oriented. Nevertheless, there are circumstances where the aggregative approach cannot be employed, and it becomes necessary to adopt the method of averaging relatives.Systems of Weighting
When determining the weights to be used in an index, it is essential to consider the intended purpose of the resulting index. For instance, if the objective of a price index is to reflect the changes in prices paid by consumers, then the weights assigned to different commodities must represent how significant each item is to consumers. Similarly, for a farm price index, the weights should indicate how important each commodity is in contributing to farmers’ income. In many cases, the commodities chosen for inclusion and the weights given to them fail to provide the necessary information for addressing a particular issue.
If price indices with weights are to be developed, and assuming the quantity of each commodity sold changes by the same proportion every year, then it would not matter which time period the weights were based on—the outcomes would remain the same. However, in practice, the relative significance of various commodities is constantly shifting. This shift is partly due to the changing relative prices of commodities, which are themselves influenced by changes in supply and demand. This situation presents a major difficulty that lacks a completely perfect solution. The appropriate response largely depends on what the analyst believes the price index is meant to accomplish.
One view is that such an index number measures the changing cost of a constant aggregate of goods. Another view concerns itself not with the goods level o f analysis, but with the sat isfact ions level; an index number, according to this view, should measure the changing cost of aggregates of goods yielding the same utility or satisfaction at two periods, or two places. Thus suppose we compare the cost of living of two groups of similar persons at two periods (or places), these groups having at the two periods (or places) the same tastes and capacity for enjoyment, as well as an income that will p00.3.u rchase, and does purchase for the same amount of satisfaction. The commodities, of course, will be different but if the expenditures were Rs. 500 the first year and Rs.550 the second year, we may conclude that the cost of living has gone up by 10 percent. It goes without saying that no one has accurately made a measurement of this kind. Although it seems feasible to measure only the varying value of a fixed, aggregate of goods, yet the analyst should select a list of gods that will avoid the certainty of bias in a known direct ion with respect to the cost of obtaining equal sat isfact ions at different times.
As described earlier index numbers (or indices) are those measures, which indicate relative changes in the value of a variable over a period of time, the most popular index number being the price index number. From the initial discussion, it is apparent that the index number is the ratio of two quantities with reference to two time periods. An index number is obtained for any given time period, generally termed as the current period, in comparison with some reference period known as the base period. For example, if one has to speak about the price index for cotton prices in the year 1995 with reference to 1980 as the reference year, 1980 will be termed as the base year while 1995 will be known as the current year.
Notation:
Before discussing the construction of the index number, let us explain the notation and terminology used.
I₀ⱼ = Index number for the current year j with reference to base year o
I₀₁ = Index number for the current year 1 with reference to base year o
P₀₁ = Price Index number for the current period 1 as compared to the base year
pᵢⱼ = Price of jᵗʰ commodity in iᵗʰ year
p₀ⱼ = Price of jᵗʰ commodity in base year ‘O’
p₁ⱼ = Price of jᵗʰ commodity in current year ‘1’
qᵢⱼ = Quantity consumed of jᵗʰ commodity in iᵗʰ year
q₀ⱼ = Quantity consumed of jᵗʰ commodity in ‘O’ base year
q₁ⱼ = Quantity consumed of jᵗʰ commodity in current year ‘1’
Calculation of Index Numbers
Broadly, the calculation of price index can be divided into two subgroups, namely
(a) Simple (unweighted) Aggregate method.
(b) Weighted Aggregates method.
Now, let us discuss both of these, one by one.
(a) Simple Aggregate method: This method consists of expressing aggregate of prices in any year as a percentage of their aggregate in base year.
Thus price index for the ith year as compare to base year (‘o’) in given as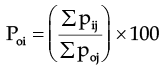 And
And
Quantity index –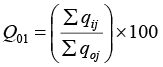
This formula is very simple for the purpose of calculation and so provides a quick measure of Index number when one has to obtain Index number for similar type of articles, e.g. crop items like wheat. rice, bajra, gram etc. But if prices of commodities under study have different units i.e. per kg, per meter, per ton, this formula is not of any use as different units cannot be summed us directly.
Thus merits and demerits of this formula are –
Merit: It is an easy and quick method and so come in handy for a quick overview of the situation.
Demerits:
- It does not take into account the fact that articles or commodities whose prices are to be added have different importance. Thus prices of commodities which are not much important will affect the index number.
- As said earlier, this formula cannot be used when commodities involved have different units for prices or for quantities.
During to these demerits, this formula is mot of much use for practical purposes.
(b) Weighted Aggregate method: In this method appropriate weights are assigned to different commodities to make them comparable and thus compatible for summation. Thus, a weighted index is –
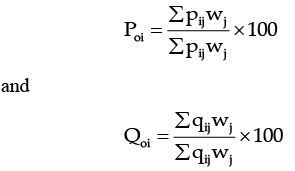
Where wj is the weight assigned to jth commodity.
Thus in this method the commodities of higher importance are given higher weight and vice versa. In this way, each commodity selected for obtaining the index number influence it according to its weight (i.e. importance, literally). Or in other words, alottement of weights enables the commodities of greater importance to have more impact on index number.
Now, time to time various renowned statisticians and research workers have suggested different methods for allotment of weight (wj) to the commodities. So a person interested in obtaining an index number has a large number of choices to select from. Some important formulae, which are treated as standard ones are given below
Important Formulae
Various methods have been suggested by different workers time to time. These methods give different formula on the basis of choice of different weights. Though the basic character of an index number does not changes and it gives the relative change yet choice of weight changes the utility and purpose of index number and vice versa.
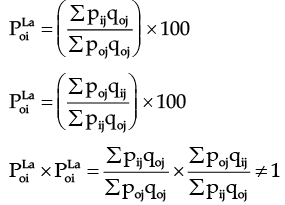
(A). Laspeyre’s Price Index or Base Year Method
French economist Laspeyere in 1871, suggested that quantities of commodities consumed in base year can be taken as weights for the purpose of calculating index numbers.
That is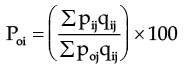 Where notation bear their usual meaning. The upper suffix ‘La’ is added to distinguish this formula as ‘Laspeyere’s’ Index number.
(B). Paasche’s Price Index or Given Year Method
By taking year quantities as weights, we get Paasche’s formula. This formula is suggested by German statistician Paasche in 1874 and so it is named after him and while writing this formula, as in earlier case, we add upper suffic ‘Pa’. Thus 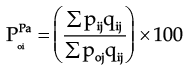 (C). Marshall – Edgeworth Price Index number
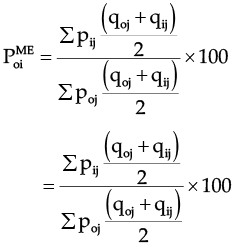
The statistician Marshall and Edgeworth suggested that to obtain a better index number we should use simple average of base year and current year quantities as the weights.
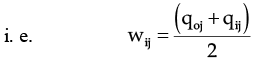 Hence, Marshall Edgeworth Price index no. is-
(D). Irving Fisher’s Index Number
Fisher’s index number is the geometric mean of the Laaspeyere’s and Paasche’s formula.Mathematically –
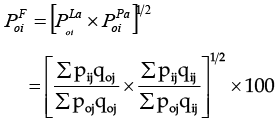 This formula holds the view that neither base year nor current year quant it ies are fully appropriate to use as weights, so a geometric mean of Laspeyere’s and Paasche’s formula can be more appropriately used as weight for obtain index number. We will further observe that this formula satisfies several tests and so it is taken as the best of all formulae suggested above. In fact, it is known as “Fisher’s Ideal Index Number”.
There are several other index numbers also, given my other research workers. Some known names are Dorbish – Bowley’s index number and Walsch’s index number. But only four formulae mentioned above are most commonly used in general Practice and so these are established standard formulae for calculating Price Indices.
Other Indices
On the basis of requirement of economic workers various formulae can be developed .For example we can have an index of global warming , an index for depletion of ozone layer ,an index for change in literacy rates in different parts of the country etc. The thing is that the sky is the limit when we go for applications of index numbers .On the basis of different roles these indices play and on the basis of different factors these are based on these indices are known by different names.Some of the important formulae are listed below.
Quantity Index Numbers
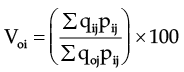
In the above formula we concentrated ourselves on price index numbers. By interchanging the price (pij) and quantities (qij) in the above formula we get the corresponding formulae for the calculation of quantity index numbers which reflect the change in the volume of quantity or production.
Quantity Index Numbers study the changes in the volume of goods produced (manufactured), consumed or distributed, like the indices of agriculture production, industrial production, imports and exports etc.. They are extremely helpful in studying the level of physical output in an economy.
Value Index Numbers
Value index numbers are given by the aggregate expenditure for any given year expressed as a percentage of the same in the base year.
Thus
 However these indices are not as common as price and quantity indices.
The Criteria of a Good Index Number
A number of mathematical test discussed below have been suggested for comparing various index numbers.
- Unit Test: This test requires the index numbers to be independent of the units in which prices and quantities are quoted. This test is satisfied by all the formulae 1-4.
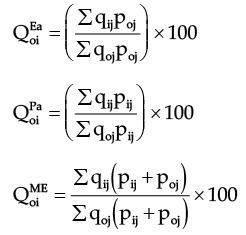
- Time Reversal Test: This is one of the two very important test proposed by Irving Fisher as tests of consistency for a good index number. According to this ‘the formula for calculating an index number should be such that it will give the same ratio between one point of comparison and the other no matter which of the two is taken as base.
In notations we have –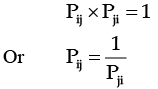 For example if we take the Laspeyre’s formula
 Hence Laspeyre’s formula does not satisfy Time Reversal Test. Similarly it can be seen that Paasche’s formula also does not satisfy this test.
For the Fisher’s ideal formula.
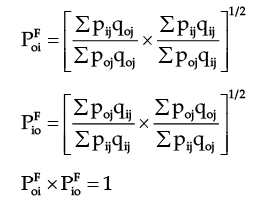 Hence Fisher’s ideal index satisfies Time Reversal Test.
 |
Download the notes
Introduction to Index Numbers, Business Mathematics and Statistics
|
Download as PDF |
Factor Reversal Test
This is the second test of consistency suggested by I. Fisher. In his words: “Just as our formula should permit the interchange of two items without giving inconsistent results, so it ought to permit interchanging the prices and quantities without giving inconsistent results – i.e. the two results mult iplied together should give the true value ratio, except for a constant of proportionality”.
Symbolically we should have
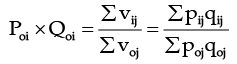
For example,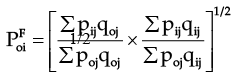
and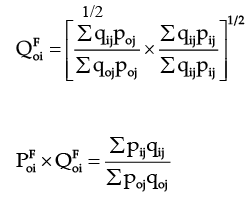 Hence Fisher’s ideal index satisfies Factor Reversal Test. It may be pointed out that none of the other formulae satisfies the factor reversal test.
It is evident that Fisher’s index fulfills both the time reversal test and the factor reversal test. Due to this characteristic, it is referred to as the ‘Ideal Index Number’.
The simple aggregate method for constructing index numbers involves expressing the total of prices in the given year as a percentage of the total in the base year. However, this method does not take into account the relative significance of the individual commodities. Furthermore, when the group of items involves different units of measurement, this approach cannot be applied.
Laspeyre’s index number employs the quantities from the base year as weights, whereas Paasche’s index number utilizes the quantities from the current year as weights.
Fisher’s index number is calculated as the geometric mean of Laspeyre’s and Paasche’s index numbers. It is recognized as an ideal index number since it meets the criteria of both the time reversal and factor reversal tests.
Consumer Price Index
As we have studied earlier, price index number is the measure of relative changes in the prices of some commodity over a period of time. In practice these indices are used for various different purposes. One very important use of the theory of index number is in obtaining consumer price index or alternatively also called cost of living index number.
It is a well known fact that the prices of the commodities required for day to day living go on increasing, e.g. prices of food items like wheat, rice, oil etc. are different in different years. This increase (or decrease, if there is any) in prices of commodities directly hit the purchasing power of consumer. A consumer price index is, therefore, devised to measure the over all changes in the purchasing power of the consumer.
- A consumer price index or cost of living index measures how much prices change for a set of essential items that a specific group of people uses.
- It helps us understand how much wages need to increase for consumers to keep their standard of living over time.
- To do this, we categorize a household's expenses into areas such as:
- Food
- Clothing
- Rent
- Electricity
- Entertainment
- Education
- Medicines
- Miscellaneous
- The Consumer Price Index number or Cost of Living Index number shows how price changes for these goods and services affect what people can buy compared to a previous time period.
- A change in an individual's cost of living between two periods reflects the change in their money income needed to maintain the same standard of living in both periods.
- Therefore, cost of living index numbers aim to measure the average increase in the cost of maintaining the same quality of life in a certain year compared to a base year.
Construction of Consumer Price Index Number
- The consumer price index (CPI), also called the cost of living index, shows the average changes over time in the prices that consumers pay for a specific group of goods and services.
- The purpose of creating consumer price indices is to provide a clearer picture of how changes in the general price level impact the cost of living for various groups of people.
- Different groups experience price changes differently because they tend to buy different types of products.
- For instance, the spending habits of the rich, poor, and middle class can vary greatly.
- Even among the same class, consumption patterns can differ based on location.
- An example is that a lower division clerk living in Delhi may have different expenses compared to a clerk of the same level living in Mumbai.
- The consumer price index is useful for understanding how changes in prices affect different consumer groups across various regions.
- This index is important because it often influences demands for higher wages, as wages and salaries in many countries are adjusted based on the CPI.
- It’s important to understand that the cost of living index does not reflect the actual cost of living or changes caused by factors other than price changes.
- Instead, its goal is to determine how much more a specific group of consumers has to pay for a set basket of goods and services during a certain period compared to a base period.
- To clarify this point, the Sixth International Conference of Labor Statisticians suggested that the term “cost of living index” be replaced with terms like price of living index, cost of living price index, or consumer price index.
- Currently, the terms cost of living index, consumer price index, and retail price index are used in various countries with little difference in meaning.
It should be clearly understood at the very outset that two different indices representing two different geographical areas cannot be used to compare actual living costs of the two areas. A higher index for one area than for another with the same period is no indication that living costs are higher in the one than in the other. All it means is that as compared with the base periods, prices have raised more in one area than in another. But actual costs depend not only on the rise in prices as compared with the base period, but also on the actual cost of living for the base period which will vary for different regions and for different classes of population.
Computation of Consumer Price Index No.
For computing consumer Price Index no. or cost of living index no. we need to have prices and quantity consumed for different categories of items in base a year and current year.
Let poj = Price of jth commodit y in 0 year (base year)
pij = Price of jth commodit y in I year (current year).
qoj = Quantity consumed for jth commodit y in 0 year (base year)
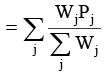
Now, consumer Price Index no. is derived as the weighted average of the price relatives, the weight being the values of the quantities consumed in the base year.
Price relative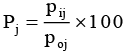
And Weight
Wj = poj .qoi
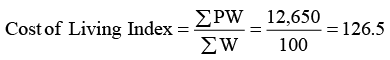
Then, Consumer Price Index
 Construct the cost of living index for the year 1982 (Base 1980 = 100).
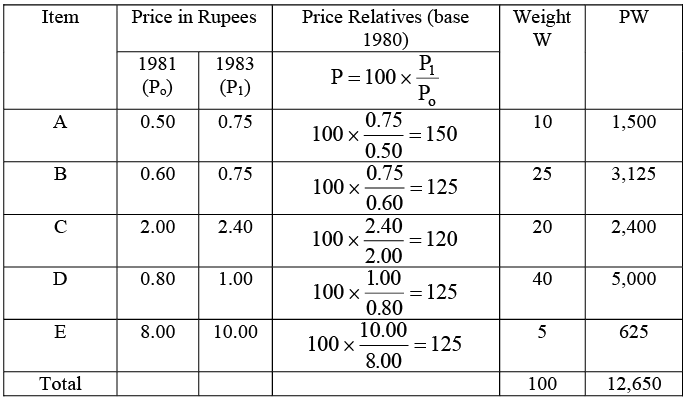
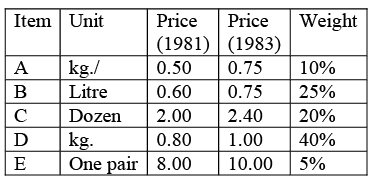 The consumer price index is obtained by the method of weighted price relatives.
Computation of Cost of Living Index Number
 Steps in construction of Consume Price Index.
The main steps which are required for construction of CPI are described below.
(1) Decision about the class of people for whom the index is meant
It is crucial to clearly define the specific class of people for whom the index is intended, such as industrial workers, teachers, or officers. The scope of the index must be well established. For instance, when referring to teachers, it is necessary to specify whether the index pertains to primary school teachers, middle school teachers, or all teachers collectively. In addition to identifying the class of people, it is equally important to determine the geographical area that the index will cover.
(2) Conducting family budget enquiry
Once the scope of the index is established, the next step involves conducting a family budget enquiry that includes the population group for whom the index is being developed. The purpose of this enquiry is to determine the expenditure of an average family within the selected group on various consumption items. During this process, both the quantity of commodities consumed and their respective prices are taken into consideration. This helps in understanding the consumption pattern. It is essential that the family budget enquiry for the group to whom the index applies is carried out during the base period. The Sixth International Conference of Labour Statisticians held in Geneva recommended that, whenever possible, the period of family budget enquiry should coincide with the base period.
The enquiry is conducted using a random sampling approach. Families are selected through a lottery method from the entire population, and their family budgets are thoroughly examined.
(3) Deciding on the items.
The items on which the money is spent are classified into certain well–accepted groups. One of the choicest and most frequently used classification is –
(i) Food
(ii) Clothing
(iii) Fuel and light ing
(iv) House Rent
(v) Miscellaneous Each of these groups is further divided into sub–groups. For example, the broad group ‘food’ may be divided into wheat, rice, pulses, sugar etc. The commodities included are those which are generally consumed by people for whom the index is meant. Through family budget enquiry an average budget is prepared which is the standard budget for that class of people. While constructing the index only such commodities should be included as are not subject to wide variations in quality or to wide seasonal alterations in supply and for which regular and comparable quotations of prices can be obtained.
(4) Obtaining price quotations.
The collect ion of retail prices is very important and at the same time, very tedious and difficult task also. That is because such prices may vary from place to place, shop to shop and person to person. Price quotations should be obtained from the localities in which the class of people concerned reside or from where they usually make their purchases. Some of the principles recommended to be observed in the collection of retail price data required for purposes of construction of cost of living indices are described below:
(a) The retail prices should relate to a fixed list of items and for each item., the quality should be fixed by means of suitable specifications.
(b) Retail prices should be those actually charged to consumers for cash sales.
(c) Discount should be taken into account if it is automat ically given to all customers.
(d) In a period of price control or rationing, where illegal prices are charged openly, such prices should be taken into account along with the controlled prices.
The most challenging issue in practice is adhering to principle (a), which involves maintaining consistent weights and the quality of the basket of goods and services to ensure that only the impact of price changes is measured. To maintain uniform quality standards, the commonly accepted approach is to create detailed descriptions or specifications of the priced items. These specifications serve as a reference for individuals responsible for providing or collecting price quotations.
Since prices constitute the most crucial component of cost-of-living indices, significant attention must be given to the methods of price collection and the personnel involved in this process. Prices are typically gathered by specialized agents, through mailed questionnaires, or occasionally from published price lists. The most reliable method is direct price collection by special agents, who visit designated retail outlets and record the prices. However, it is essential that these agents are carefully selected and adequately trained. They should also be provided with a detailed instruction manual along with a manual specifying the characteristics of the items to be priced.
To ensure accuracy, appropriate price verification techniques should be employed. One such method is "check pricing," where price quotations are validated through duplicate entries collected by different agents. Another method is "purchase checking," which involves verifying prices by making actual purchases of goods.
(5) Working on CPI
After quotations have been collected from all retail outlets an average price for each of the items included in the index has to be worked out. Such averages are first calculated for the base period of the index and later every month if the index is maintained on a monthly basis. The method of averaging the quotations should be such as-to yield unbiased estimates of average prices as being paid by the group as a whole. This of course, will depend upon the method of selection of retail outlets and also the scope of the index.
In order to convert the prices into index numbers the prices or their relatives must be weighted. The need for weighting arises because the relative importance of various items for different classes of people is not the same. For this reason, the cost of living index is always a weighted index. While conducting the family budget enquiry the amount spent on each commodity by an average family is decided and these constitute the weights. Percentages of expenditure on the different items constitute the individual weights, allocated to the corresponding price relative and the percentage expenditure on the five groups constitute the group weight.
Uses and limitations of consumer price index
- These indices are created for various groups of people, including low income, middle income, clerical, and labor class. They help to evaluate the overall price changes of products that these groups typically buy.
- The cost of living index numbers show whether real wages are increasing or decreasing, assuming that money wages stay the same. In simpler terms, they help calculate real wages and assess how much purchasing power money has.
- Cost of living indices are important for adjusting dearness allowance or providing bonuses to workers, helping them cope with the rise in living costs.
- These indices are also utilized for adjusting income and value figures in national accounts.
- On their own, cost of living index numbers do not provide a clear understanding of whether the economy is experiencing inflation or deflation. However, when used alongside other indicators, such as wholesale price indices, wages, profits, production, and employment, they can help analyze the overall price situation in the economy.
 |
Take a Practice Test
Test yourself on topics from SSC CGL exam
|
Practice Now |
Base Shifting of Index Numbers
Base shifting means the changing of the given base period (year) of a series of index numbers and recasting them into a new series based on some recent new base period. This step is quite often necessary under the following situations :
(i) When the base year is too old or too distant from the current period to make meaningful and valid comparisons.
(ii) If we want to compare series of index numbers with different base periods, to make quick and valid comparisons both the series must be expressed with a common base period.
Base shifting requires the recompilation of the entire series of the index numbers with the new base. However, this is a very difficult and time consuming job. A relatively much simple, though approximate method consists in taking the index number of the new base year as 100 and then expressing the given series of index numbers as a percentage of the index number of the time period selected as the new base year. Thus, the series of index numbers, recast with a new base is obtained by the formula : Recast Index No. of any year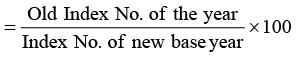

In other words, the new series of index numbers is obtained on multiplying the old index numbers with a common factor :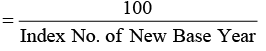
If arithmetic mean or median is used for averaging the price relatives then the usual method of base shifting consists in calculating the price relatives for each individual item w.r.t. the new base and then averaging their totals, i.e., the whole of the series is to be reconstructed. However, in practice, even in these cases the approximate method described above gives result which are fairly close to those obtained otherwise.
Splicing Two Index Numbers Series
In order to obtain continuity in the comparison of two or more overlapping series of index numbers, we combine or splice them into a single continuous series. For example, suppose an index number series 'A' with base period 'a' is discontinued in 'period' 'b' due to certain reasons and a new series 'B' of index numbers is computed with base period 'b' (and the same items). In order to compare the series 'B' with 'A' we splice the series B to A to obtain a continuous series from 'a' onwards. The process is very much alike to that of base shift ing and is illustrated below :
Splicing of Two Index Number Series
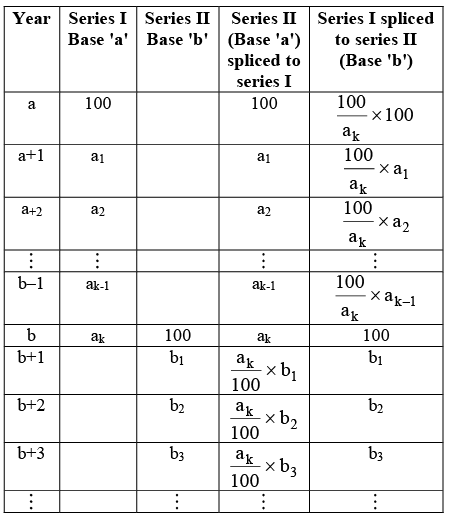
Explanation: When series II is spliced to series I to get a continuous series with base 'a'.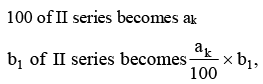
and b₂ of II series becomes (aₖ/100) × b₂, and so on. Thus multiplying each index of the series II with a constant factor (aₖ/100), we get the new series of index numbers spliced to series I (Base 'a'). In this case series I is also said to be spliced forward.
If we splice series I to series II to get a new continuous series with base 'b' then,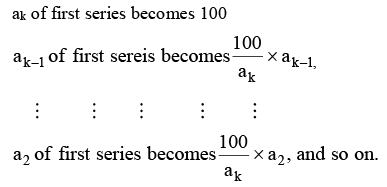 Thus the new series of index numbers with series I spliced to series II (Base 'b') obtained on multiplying each index of series I by new constant factor (100/ak). In this case we say that series is spliced backward.
Given below are two price index series. Splice them on the base 1974=100. By what per cent did the price of steel rise between 1970 and 1975?
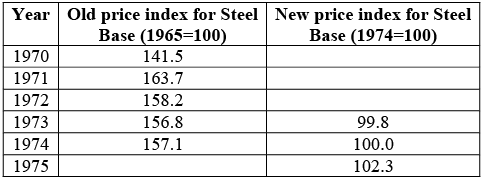
Splicing of Old Price Index to New Price Index
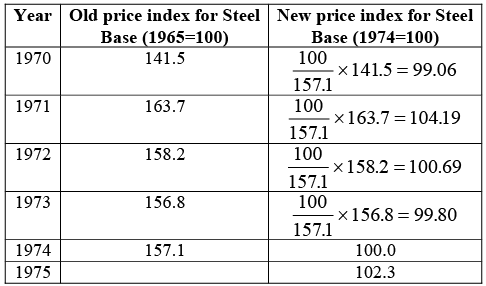
The percentage increase in the price of steel between 1970 and 1975 is 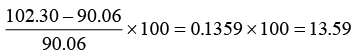 Hence, the required increase is 13.59%.
Deflating the Index Numbers
Deflating means "making allowance for the effect of changing price levels". The increase in the prices of consumer goods for a class of people over a period of years means a reduction in the purchasing power for the class. For example the increase in price of a particular commodity from Rs. x in base year 'a' to Rs. 2x in the year 'b' implies that in 'b' a person can buy only half the amount of the commodity with Rs. x which he was spending on it in 'a'. Thus the purchasing power of a rupee in only 50 paise in 'b' as compared to 'a'.
The idea of "the purchasing power of money" or "a measure of the real income" for a class of people is obtained on deflating the wage series by dividing each item by an approximate price index e.g., the cost of living index. The real wages so obtained my be converted into index number if desirable. More precisely,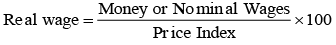
The real income is also known as deflated income. This technique is extensively used to deflate value series or value indices, rupee sales, inventories, income wages and so on.
Index of Industrial Production
The index of industrial production is aimed at reflecting changes (increase or decrease) in the volume of industrial production (i.e., production of nonagricultural commodities) in a given period compared to some base period. These indices measure, at regular intervals, the general movement in the quantum of industrial production. Such indices are useful for studying:
(i) The progress of general industrializat ion of a country, and
(ii) The effect of tariff on the development of particular industries.
These indices of industrial activity are of great importance in the formulation and implementation of industrial plans. For the construction of the indices of industrial production, the data about production of various industries are usually collected under the following heads:
(i) Text ile Industries: Cotton, silk, woolen, etc.
(ii) Metallurgical Industries: Iron and steel, etc.
(iii) Mining Industries: Coal, pig-iron and Ferro-allo ys, petrol, kerosene, copper (virgin metal), etc.
(iv) Mechanical Industries: Locomotives, sewing machines, aero-planes, etc.
(v) Industries subject to excise duty: Tea, sugar, cigarettes and tobacco, distilleries and breweries, etc.
(vi) Electricit y, gas and steam; Electric lamps, electric fans, electrical apparatus and appliances, etc.
(vii) Miscellaneous: glass, paints and varnish, paper and paper-board, cement chemicals etc.
Usually, the data (figures of output) are obtained for various industries on monthly basis and the indices of industrial production are obtained as the weighted arithmetic mean (or sometimes geometric mean) of the production (quantity) relatives by the formula: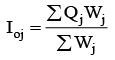 Where Qj = production relat ive = qij/qoj,
And Wj is the weight assigned to jth them (industry).
The weights may be assigned to various industries on the basis of, say, capital invested, net output, production etc. The concept of 'value added by manufacture' is the most commonly used criterion for determining the weights to be assigned to different industries
|
1366 videos|1313 docs|1016 tests
|
FAQs on Introduction to Index Numbers, Business Mathematics and Statistics - SSC CGL Tier 2 - Study Material, Online Tests, Previous Year
| 1. What is an index number in business mathematics and statistics? |  |
| 2. How are index numbers calculated? | |
| 3. What are the advantages of using index numbers in business mathematics and statistics? | |
| 4. How are index numbers used in business and economics? | |
| 5. What are some limitations of using index numbers in business mathematics and statistics? | |


Business Mathematics and Statistics | SSC CGL Tier 2 - Study Material
,Introduction to Index Numbers
,Online Tests
,ppt
,Previous Year Questions with Solutions
,Summary
,Business Mathematics and Statistics | SSC CGL Tier 2 - Study Material
,Previous Year
,Business Mathematics and Statistics | SSC CGL Tier 2 - Study Material
,shortcuts and tricks
,Sample Paper
,Online Tests
,Important questions
,practice quizzes
,Semester Notes
,Introduction to Index Numbers
,MCQs
,Previous Year
,Extra Questions
,Introduction to Index Numbers
,Previous Year
,video lectures
,Viva Questions
,Online Tests
,past year papers
,Objective type Questions
,mock tests for examination
,study material
,Free
,Exam
;


Introduction to Index Numbers, Business Mathematics and Statistics Free PDF Download
Importance of Introduction to Index Numbers, Business Mathematics and Statistics
Introduction to Index Numbers, Business Mathematics and Statistics Notes
Introduction to Index Numbers, Business Mathematics and Statistics SSC CGL Questions
Study Introduction to Index Numbers, Business Mathematics and Statistics on the App
|
© EduRev
|
Education Revolution
|


|


