Introduction to Statistics | Quantitative for GMAT PDF Download
| Table of contents |
|
| Descriptive Statistics |
|
| Measures of Central Tendency |
|
| Measures of Dispersion |
|
| Inferential Statistics |
|
| Some Solved Questions |
|
Statistics is the practice or science of collecting and analyzing numerical data in large quantities, especially for the purpose of inferring proportions in a whole from those in a representative sample.
There are two categories in statistics:
1) Descriptive statistics
2) Inferential statistics

Descriptive Statistics
Descriptive statistics is a summary of certain data, whose purpose is to give an overview.
- The most commonly used example of this is the average, like the average marks obtained by a student in math in a period of 3 years.
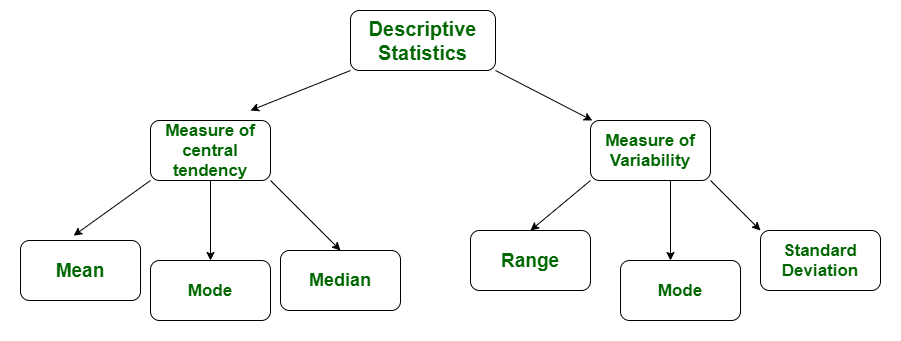
Categories of Descriptive Statistics
1. Measures of Central Tendency
- Mean, Median, and Mode
- Locates the distribution by various points
2. Measures of Dispersion or Variation
- Refer to how far the values in a data set have deviated from the mean value.
- Range, Variance, Standard Deviation
- Identifies the spread of scores by stating intervals
- Range = High/Low points
- Variance or Standard Deviation = difference between observed score and mean
3. Measures of Position
- Percentile Ranks, Quartile Ranks
- Describes how scores fall in relation to one another. Relies on standardized scores
- Use this when you need to compare scores to a normalized score (e.g., a national norm)
Measures of Central Tendency
- Measures of Central tendency refer to a value that is usually the center point of a data set.
- The most common measures of central tendency are mean, median, and mode.
1. Mean
The Mean also called the Arithmetic Mean or the Average, of a set of numbers is obtained by calculating the sum of all elements in the set divided by the number of elements in the set.
Formula for Calculating the Mean / Average
Mean = Sum of the elements/Number of elements in the set.
Consider the following example:
Q. Tom scored 88 in English, 97 in Math, 90 in Science and 85 in Social Studies. Calculate his average marks.
Solution: Average marks obtained by Tom = (88+97+90+85)/4 = 90.
2. Median
The Median of a data set is the middle value of the set when the elements are arranged in ascending or descending order.
- When a data set has an odd number of elements, we choose the middle value.
- When the data set has an even number of elements, the average or the mean of the two middle values becomes the median.
Consider the following examples:
Q.1. Find the median of the set {4, 7, 1, 0, 9}.
Solution: Arranging the set in an order = {0, 1, 4, 7, 9}
4 is the median of this set.
Q.2. Find the median of the set {3, 2, 5, 10, 8, 7}
Solution: Arranging the set in an order = {2, 3, 5, 7, 8, 10}
Median = (5+7)/2 = 6 is the median of this set.
Note:
When a set is evenly distributed, which means the difference between consecutive elements of the set is equal, the median and mean of the set are equal.
This can be verified with the help of an example.
Q.3. Find the mean and median of the set {4,8,10,6}
Solution:
Mean = (4+8+10+6)/4 = 28/4 = 7
Median = {4,6,8,10} = (6+8)/2 = 14/2 = 7
42,54,12,89,56,75,29,13,20,11,34
3. Mode
The Mode of a data set is the most frequently occurred value in the set.
A set may have more than one mode or no mode at all.
Consider the following examples:
Q.1. 3, 4, 7, 3, 1, 2, 3, 9, 13
Solution: 3 is the mode in this set.
Q.2. 21, 34, 9, 57, 64, 34, 90, 9, 12, 2, 34, 9
Solution: This is a bimodal set. 34 and 9 are its modes.
Q.3. 6, 7, 36, 2, 1, 41
Solution: This set has no mode.
Q.4. The mean of 2,6,9,13,x is 9. Find the median of {22,x,38,11,5,9}.
Solution:
(2+6+9+13+x)/5 = 9
30+x = 5*9
X = 45-30 = 15.
For finding Median, arranging the numbers in an order,
{5,9,11,15,22,38}
The median is (11+15)/2 = 26/2 = 13
Measures of Dispersion
We will be focusing on two measures of Dispersion: Range and Standard deviation.
1. Range
This is probably the simplest measure of dispersion. It is obtained by calculating the difference between the highest and the least values of a set.
The range of the data set {3, 4, 10, 14, 8} is 14-3 = 11.
2. Standard Deviation
The Standard deviation of a set is calculated in five steps.
- Calculate the arithmetic mean of the set.
- Find the difference between each value and the arithmetic mean.
- Square the differences of each value.
- Find the average of the squared differences. [The value obtained at this step is called the variance. Standard deviation is simply the square root of variance].
- Find the square root of the average.
Q.1 Calculate the standard deviation for the set {3,4,8,10}.
Solution:
To calculate the standard deviation for a set of numbers, follow these steps:
- Find the mean (average) of the set.
- Subtract the mean from each number to find the deviation from the mean for each number.
- Square each deviation.
- Find the mean of the squared deviations.
- Take the square root of the mean of squared deviations to get the standard deviation.
Let's calculate it step by step for the set {3, 4, 8, 10}:
Find the mean:
- Mean = (3 + 4 + 8 + 10) / 4 = 25 / 4 = 6.25
Find the deviation from the mean for each number:
- Deviation for 3 = 3 - 6.25 = -3.25
- Deviation for 4 = 4 - 6.25 = -2.25
- Deviation for 8 = 8 - 6.25 = 1.75
- Deviation for 10 = 10 - 6.25 = 3.75
Square each deviation:
- (-3.25)2 = 10.5625
- (-2.25)2 = 5.0625
- (1.75)2 = 3.0625
- (3.75)2 = 14.0625
Find the mean of the squared deviations:
- (10.5625 + 5.0625 + 3.0625 + 14.0625) / 4 = 32.75 / 4 = 8.1875
Take the square root of the mean of squared deviations to get the standard deviation:
- Standard Deviation = √8.1875 ≈ 2.86 (rounded to two decimal places)
So, the standard deviation for the set {3, 4, 8, 10} is approximately 2.86.
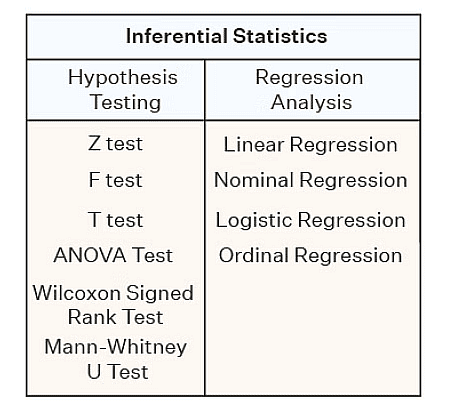
Inferential Statistics
- Inferential statistics helps to develop a good understanding of the population data by analyzing the samples obtained from it.
- It helps in making generalizations about the population by using various analytical tests and tools. In order to pick out random samples that will represent the population accurately many sampling techniques are used.
- Some of the important methods are simple random sampling, stratified sampling, cluster sampling, and systematic sampling techniques.

Some Solved Questions
Q.1. If the mean of numbers 28, x, 42, 78 and 104 is 62, what is the mean of 48, 62, 98, 124, and x?
a) 78
b) 58
c) 390
d) 310
e) 66
Answer: Option A
Solution:
Step 1: Find the sum of both the series
x is common to both the series. So, x is not going to make a difference to the average.
Only the remaining 4 numbers will contribute to the difference in average between the two series.
Sum of the 4 numbers, excluding x, of the first series is 28 + 42 + 78 + 104 = 252
Sum of the 4 numbers, excluding x, of the second series is 48 + 62 + 98 + 124 = 332
Step 2: Difference in the sum of the two series
The difference between the sum of the two sets of numbers = 332 - 252 = 80
Step 3: Calculating the average of the second series
The sum of the second series is 80 more than the sum of the first series.
If the sum of the second series is 80 more than that of the first series, the average of the second series will be 805 = 16 more than the first series.
Therefore, the average of the second series = 62 + 16 = 78.
Alternative Approach
Observe that each number in the new series, with the exception of "x", has increased by 20
This will increase the overall sum of the second series by 4 × 20 = 80
The overall sum increasing by 80 is the equivalent of each number in the series increasing by 805 = 16
If each number in the series increases by 16 the average will increase by 16 to 78
Q.2. The arithmetic mean of the 5 consecutive integers starting with 's' is 'a'. What is the arithmetic mean of 9 consecutive integers that start with s + 2 ?
a) 2 + s + a
b) 22 + a
c) 2s
d) 2a + 2
e) 4 + a
Answer: Option E
Solution:
Step 1: Understanding the given data
The first sequence of 5 consecutive numbers starts with 's' and its mean is 'a'
The mean of 5 consecutive numbers is the 3rd term - the middle term.
Hence, 'a' the mean is the middle (3rd) term.
Step 2: Relating 'a' to 's'
The first sequence starts with 's'
Hence, the terms are s, s + 1, s + 2, s + 3, and s + 4
The middle term is s + 2
Therefore, a = s + 2
Step 3: The second series and its mean
The second series of 9 consecutive numbers starts from s + 2
The terms will therefore, be s + 2, s + 3, s + 4, s + 5, s + 6, s + 7, s + 8, s + 9, and s + 10
The average of these 9 numbers is the middle term of the second series. i.e., the 5th term = s + 6
If a = s + 2, then s + 6 will be a + 4
The average of the second sequence is a + 4
Alternative Approach
The fastest way to solve such questions is to assume a value for 's'.
Let s be 1
Therefore, the 5 consecutive integers that start with 1 are 1, 2, 3, 4, and 5
The average of these 5 numbers is the middle term, which is 3. Hence, a = 3
9 consecutive integers that start with s + 2 will start from 1 + 2 = 3
The second sequence is, therefore, 3, 4, 5, 6, 7, 8, 9, 10, and 11
The average of these 9 numbers is the middle term, which is 7
If the average of the first sequence 3 = a, the average of the second sequence 7 = 4 + a
Choice E is the correct answer.
Q.3. The average weight of a group of 30 friends increases by 1 kg when the weight of their football coach was added. If the average weight of the group after including the weight of the football coach is 31 kg, what is the weight of their football coach?
a) 31 kg
b) 61 kg
c) 60 kg
d) 62 kg
e) 91 kg
Answer: Option B
Solution:
The group comprises 30 friends.
Standard Framework to Solve Averages Questions
When the football coach is also included, the average weight of the group becomes 31 kg.
As the new average is 1 kg more than the old average, old average without including the football coach = 30 kg.
Description Number Average Sum Without Coach 30 30 900 With Coach 31 31 961 Weight of Coach 961 - 900 = 61 kg The total weight of the 30 friends without including the football coach = 30 * 30 = 900.
After including the football coach, the number of people in the group increases to 31 and the average weight of the group increases by 1 kg.Therefore, the total weight of the group after including the weight of the football coach = 31 * 31 = 961 kg.
Therefore, the weight of the football coach = 961 - 900 = 61 kg.
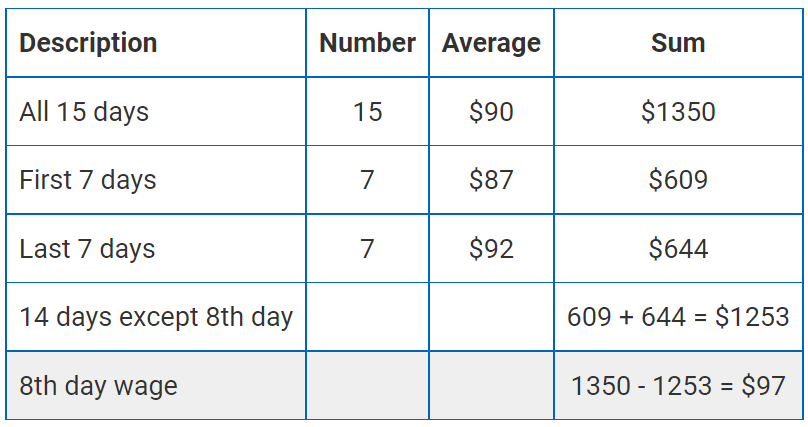
Q.4. The average wages of a worker during a fortnight comprising 15 consecutive working days was $90 per day. During the first 7 days, his average wages was $87/day and the average wages during the last 7 days was $92 /day. What was his wage on the 8th day?
a) $83
b) $92
c) $90
d) $97
e) $104
Answer: Option D
Solution:
Standard Framework
Fill in the data given in the question in the standard framework as shown above. Most questions in averages can be solved by completing this standard framework. The sum of wages is computed as the product of the number of days and the average wage earned per day.
The sum of wages earned during the 15 days that the worker worked = 15 × 90 = $1350.
The sum of wages earned during the first 7 days = 7 × 87 = $609.
The sum of wages earned during the last 7 days = 7 × 92 = $644.
Sum of wages earned for all 15 days = wages during first 7 days + wage on 8th day + wages during the last 7 days.
Or, 1350 = 609 + wage on 8th day + 644
Wage on 8th day = 1350 - 609 - 644 = $97.
Q.5. The average of 5 numbers is 6. The average of 3 of them is 8. What is the average of the remaining two numbers?
a) 4
b) 5
c) 3
d) 3.5
e) 0.5
Answer: Option C
Solution:
The average of 5 quantities is 6.
Therefore, the sum of the 5 numbers is 5 × 6 = 30.
The average of three of these 5 numbers is 8.
Therefore, the sum of these three numbers = 3 × 8 = 24
The sum of the remaining two numbers = (Sum of all 5 - Sum of 3 numbers) = 30 - 24 = 6.
Average of these two remaining numbers = 62 = 3
|
115 videos|106 docs|113 tests
|
FAQs on Introduction to Statistics - Quantitative for GMAT
| 1. What is the purpose of descriptive statistics? |  |
| 2. What are measures of central tendency? | |
| 3. How do measures of dispersion help in understanding data variability? | |
| 4. What is the difference between descriptive and inferential statistics? | |
| 5. How are statistics useful in everyday life? | |

|
1.2K Views |

|
4.71/5 Rating |

|
Dec 22, 2024 Last updated |

|
Explore Courses for GMAT exam
|
|
Introduction to Statistics | Quantitative for GMAT
,MCQs
,Viva Questions
,shortcuts and tricks
,Semester Notes
,Free
,Previous Year Questions with Solutions
,Sample Paper
,Exam
,Introduction to Statistics | Quantitative for GMAT
,past year papers
,ppt
,mock tests for examination
,Summary
,Extra Questions
,Objective type Questions
,practice quizzes
,Important questions
,video lectures
,study material
,Introduction to Statistics | Quantitative for GMAT
;


Introduction to Statistics Free PDF Download
Importance of Introduction to Statistics
Introduction to Statistics Notes
Introduction to Statistics GMAT Questions
Study Introduction to Statistics on the App
|
© EduRev
|
Education Revolution
|


|


