
This EduRev document offers 10 Multiple Choice Questions (MCQs) from the topic line Graph (Level - 2). These questions are of Level - 2 difficulty and will assist you in the preparation of CAT & other MBA exams. You can practice/attempt these CAT Multiple Choice Questions (MCQs) and check the explanations for a better understanding of the topic.
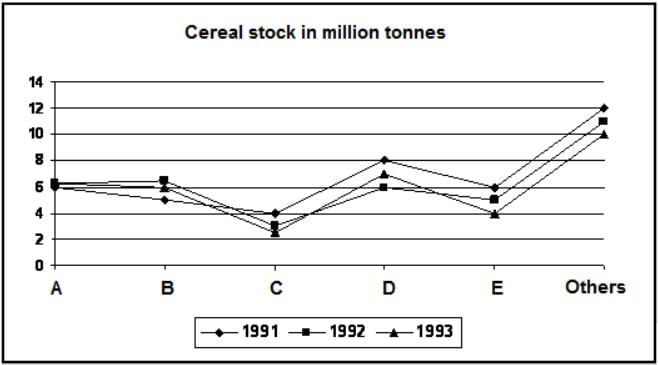
Calculate the increase in stock of cereal 1 for 1992
The graph below represents sales and net profit in Rs. crore of IVP Ltd. for five years from 1994-95 to 1998-99. During this period, the sales increased from Rs. 100 crore to Rs. 680 crore. Correspondingly, the net profit increased from Rs. 2.5 crore to Rs. 12 crore. Net profit is defined as the excess of sales over total costs. Q. Defining profitability as the ratio of net profit to net sales, it can be concluded that
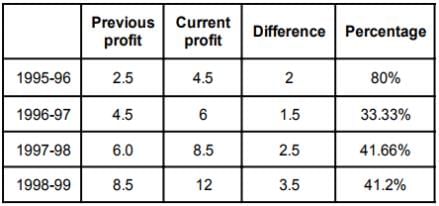
The graph below represents sales and net profit in Rs. crore of IVP Ltd. for five years from 1994-95 to 1998-99. During this period, the sales increased from Rs. 100 crore to Rs. 680 crore. Correspondingly, the net profit increased from Rs. 2.5 crore to Rs. 12 crore. Net profit is defined as the excess of sales over total costs. Q. The highest percentage growth in net profit as compared to the previous year was seen in
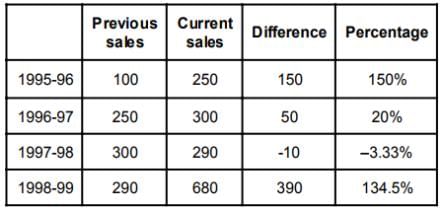
The graph below represents sales and net profit in Rs. crore of IVP Ltd. for five years from 1994-95 to 1998-99. During this period, the sales increased from Rs. 100 crore to Rs. 680 crore. Correspondingly, the net profit increased from Rs. 2.5 crore to Rs. 12 crore. Net profit is defined as the excess of sales over total costs. Q. The highest percentage of growth in sales over the previous year occurred in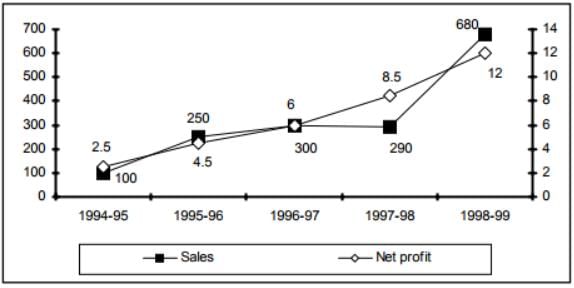
Q. The total number of units manufactured by companies R, S and U in the year 2006 is what percentage of the total number of units manufactured by Company P in all the years together?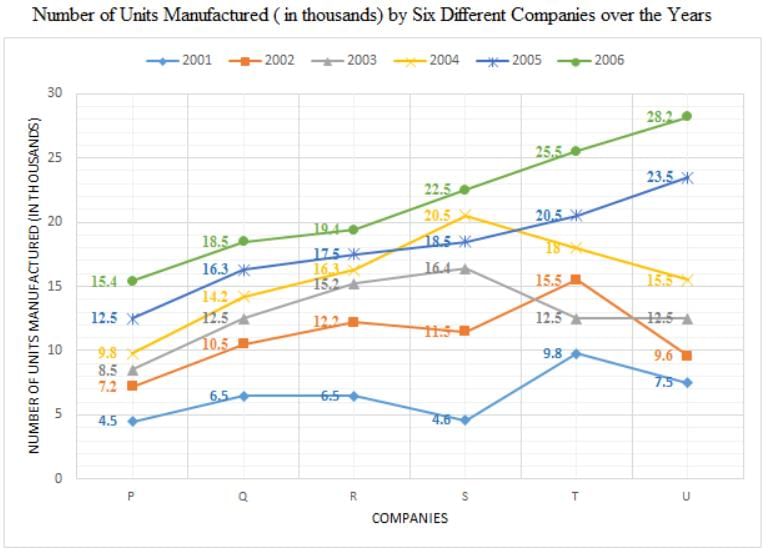
Q. What is the average number of units sold by Company S in the years 2001, 2002, 2003, 2004 and 2005?
Q. What is the respective ratio of total number of units manufactured by companies Q and R together in the year 2001 to those manufactured by companies S and T together in the year 2003?
Q. What is the average number of hard disks produced by Company 'X' over all the years together?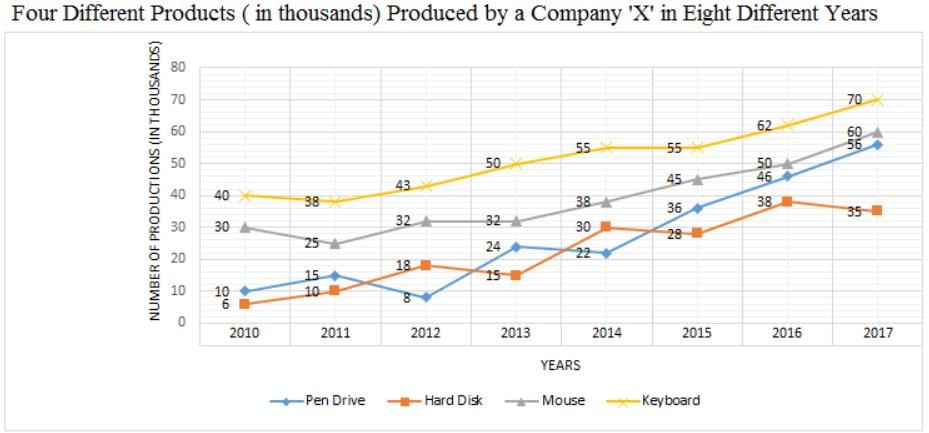
Q. What is the difference between the total number of hard disks and mouses produced by Company 'X' in the year 2010 and the total number of keyboards and pen drives produced by Company 'X' in the year 2015?
Q. What was the respective ratio between the number of pen drives produced by Company 'X' in the years 2010, 2011, 2014 and 2015 and the number of hard disks produced by Company 'X' in the years 2011, 2012, 2015 and 2017?

Previous Year Questions with Solutions
,Extra Questions
,past year papers
,practice quizzes
,Sample Paper
,Free
,Line Graph Questions for CAT with Answers PDF
,ppt
,Exam
,Semester Notes
,Line Graph Questions for CAT with Answers PDF
,Important questions
,Objective type Questions
,MCQs
,study material
,mock tests for examination
,video lectures
,Viva Questions
,Summary
,Line Graph Questions for CAT with Answers PDF
,shortcuts and tricks
;


Practice Questions Level 2: Line Graph Free PDF Download
Importance of Practice Questions Level 2: Line Graph
Practice Questions Level 2: Line Graph Notes
Practice Questions Level 2: Line Graph CAT
Study Practice Questions Level 2: Line Graph on the App
|
© EduRev
|
Education Revolution
|


|


