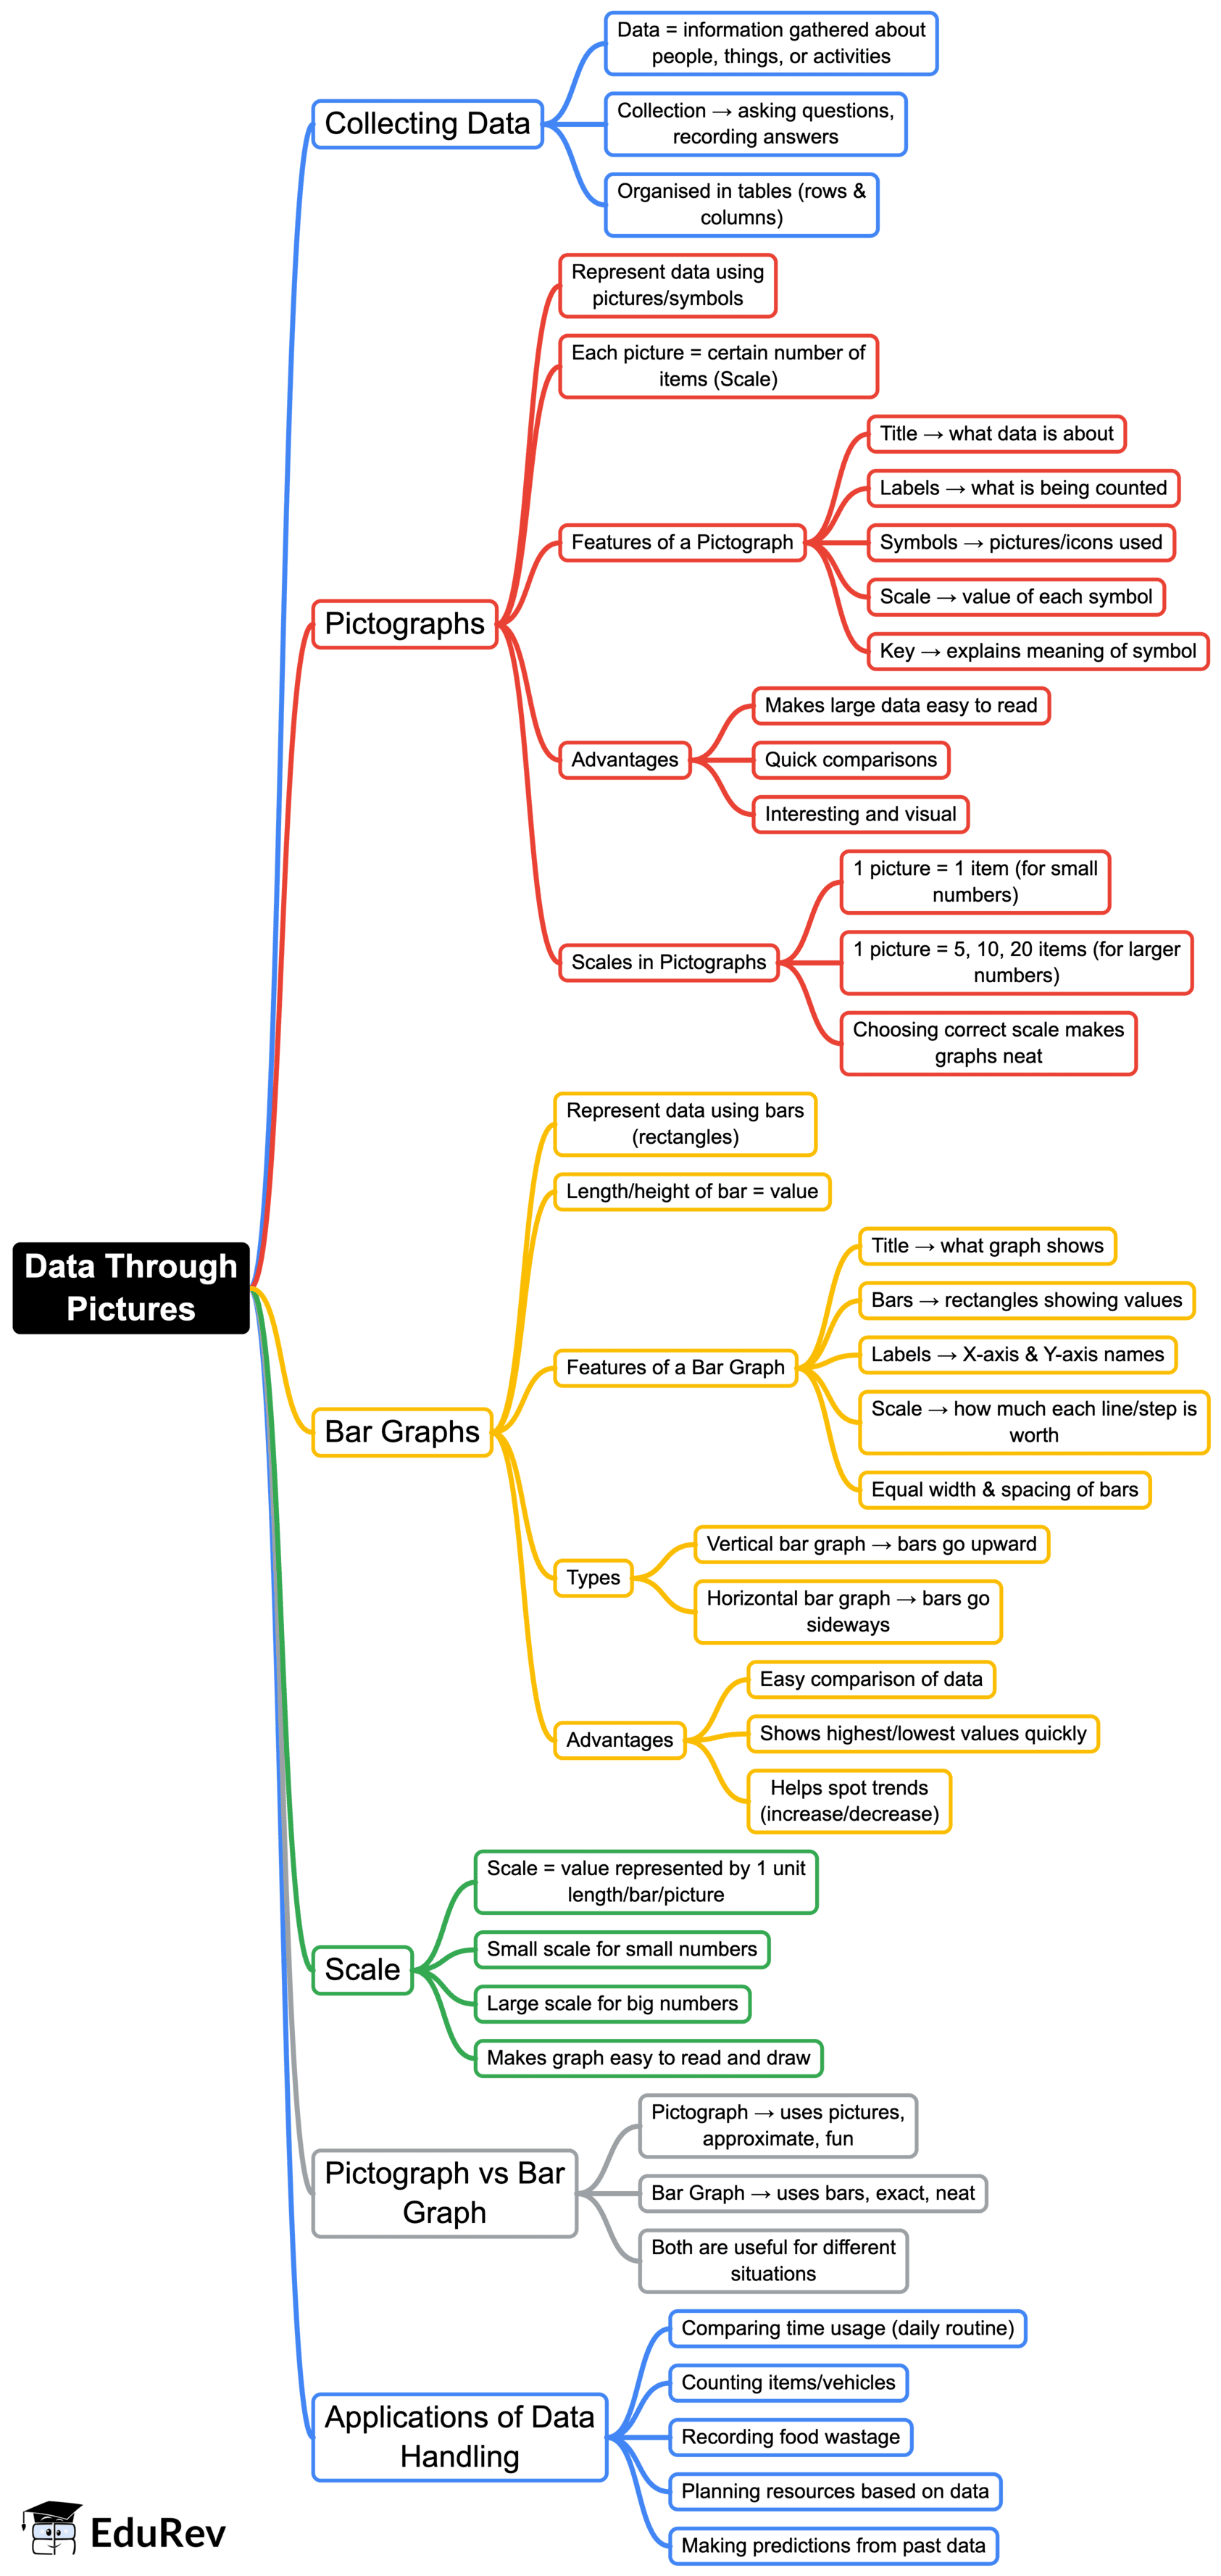
Class 5 Exam > Class 5 Notes > Mathematics (Maths Mela) Class 5 - New NCERT > Mind Map: Data Through Pictures
Mind Map: Data Through Pictures | Mathematics (Maths Mela) Class 5 - New NCERT PDF Download

The document Mind Map: Data Through Pictures | Mathematics (Maths Mela) Class 5 - New NCERT is a part of the Class 5 Course Mathematics (Maths Mela) Class 5 - New NCERT.
All you need of Class 5 at this link: Class 5
|
35 videos|276 docs|7 tests
|
FAQs on Mind Map: Data Through Pictures - Mathematics (Maths Mela) Class 5 - New NCERT
| 1. What is the importance of using pictures to represent data in learning? |  |
Ans. Using pictures to represent data helps students understand complex information more easily. Visual aids can simplify concepts, making them more relatable and memorable. They also engage different learning styles, allowing learners to visualize relationships and patterns in data, which enhances comprehension and retention.
| 2. How can charts and graphs improve data interpretation skills in students? |  |
Ans. Charts and graphs provide a visual summary of data, allowing students to quickly identify trends, compare information, and draw conclusions. By interpreting these visuals, students develop critical thinking and analytical skills as they learn to analyze data effectively and make informed decisions based on their observations.
| 3. What types of pictures can be used to represent data effectively? |  |
Ans. Various types of pictures can effectively represent data, including bar graphs, pie charts, line graphs, and pictograms. Each type serves a different purpose: bar graphs compare quantities, pie charts show proportions, line graphs illustrate trends over time, and pictograms convey information using images, making data more engaging and accessible.
| 4. How do visuals like infographics help in presenting data? |  |
Ans. Infographics combine images, charts, and text to present data in an easily digestible format. They help to tell a story with data, making complex information more approachable. Infographics can highlight key points, making it easier for viewers to understand and remember the information. This visual storytelling approach enhances communication and learning.
| 5. What skills can students develop by creating their own data visualizations? |  |
Ans. By creating their own data visualizations, students can develop a range of skills including creativity, critical thinking, and technical skills. They learn to analyze data, choose the appropriate visual format, and communicate their findings effectively. This hands-on experience fosters a deeper understanding of data concepts and enhances their ability to convey information clearly.
Related Searches


