Commerce Exam > Commerce Notes > Economics Class 11 > Mind Map: Presentation of Data
Mind Map: Presentation of Data | Economics Class 11 - Commerce PDF Download

The document Mind Map: Presentation of Data | Economics Class 11 - Commerce is a part of the Commerce Course Economics Class 11.
All you need of Commerce at this link: Commerce
|
59 videos|222 docs|43 tests
|
FAQs on Mind Map: Presentation of Data - Economics Class 11 - Commerce
| 1. What are the different types of data presentation methods? |  |
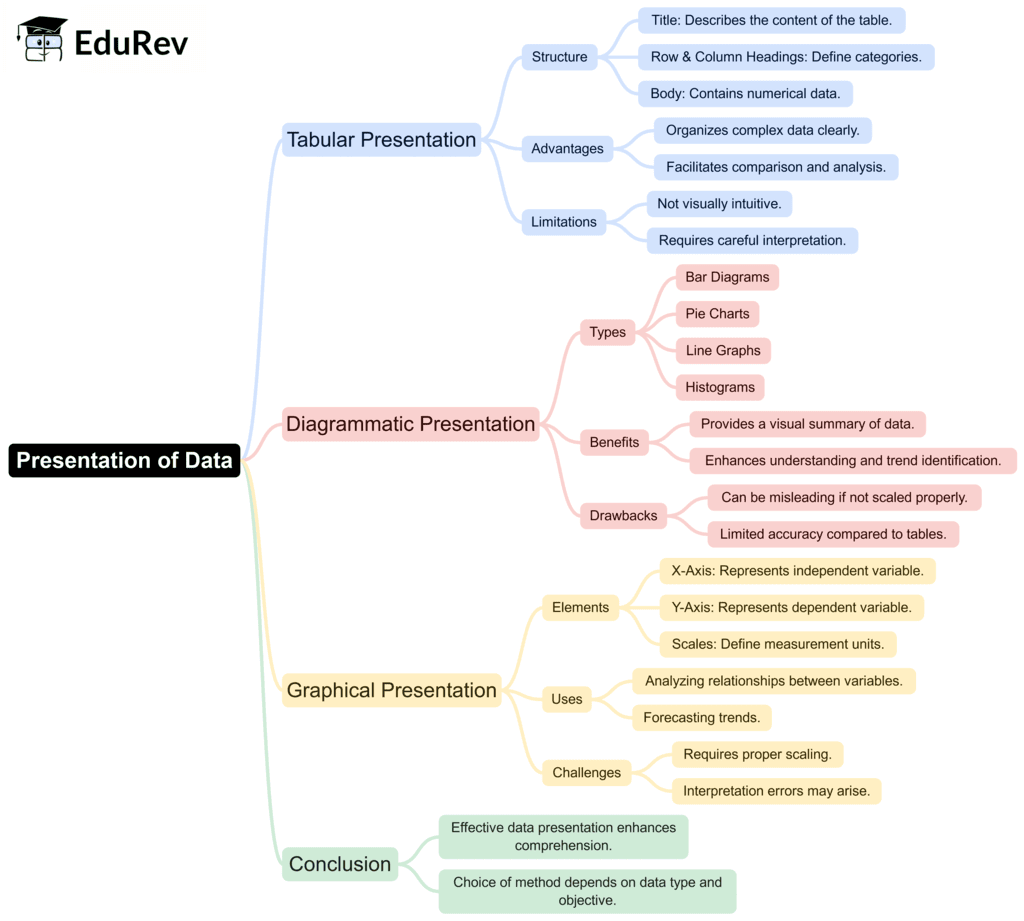
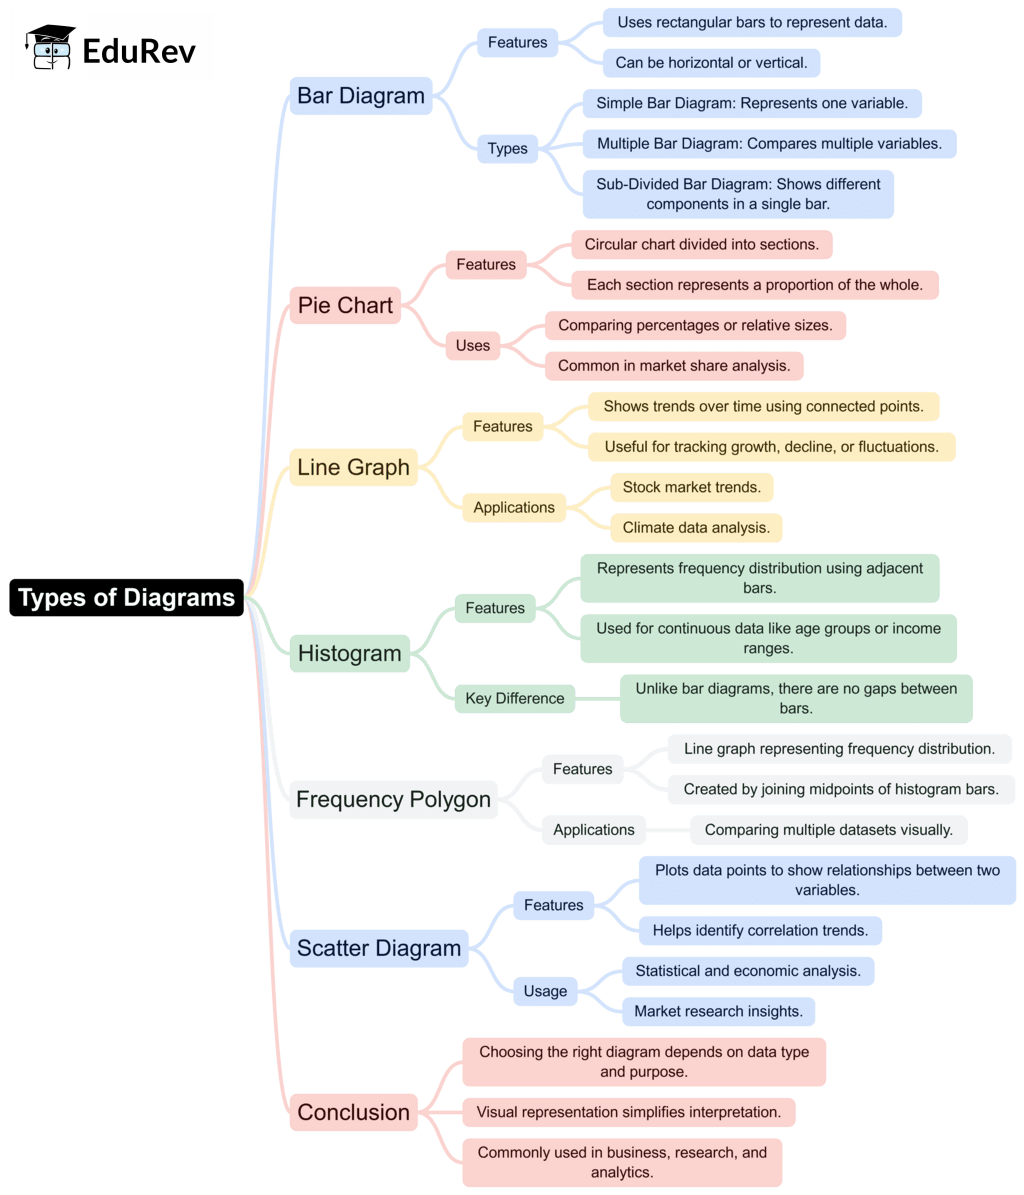
Ans. Data can be presented using various methods, including charts (such as bar, line, and pie charts), tables, graphs, infographics, and dashboards. Each method has its own strengths and is suitable for different types of data and audiences.
| 2. How can I choose the best method for presenting my data? | |
Ans. To choose the best method for data presentation, consider the audience, the type of data, and the message you want to convey. For example, charts are great for showing trends, while tables are better for precise data comparison. It’s important to select a method that enhances understanding.
| 3. What are the common mistakes to avoid in data presentation? | |
Ans. Common mistakes include overcrowding slides with too much information, using unclear visuals, neglecting to label axes and legends, and failing to tailor the presentation to the audience. Simplifying visuals and focusing on key messages can improve clarity.
| 4. How can visuals enhance the effectiveness of data presentation? | |
Ans. Visuals such as graphs and charts can simplify complex data, making it easier for the audience to understand trends and relationships. They can also engage the audience’s attention and help retain information better than text alone.
| 5. What role does storytelling play in data presentation? | |
Ans. Storytelling in data presentation helps to contextualize the data, making it relatable and memorable. By weaving a narrative around the data, presenters can highlight key findings and insights, guiding the audience through the data in a compelling way.
About this Document

4.73/5
Rating

Oct 22, 2025
Last updated
Related Exams
Document Description: Mind Map: Presentation of Data for Commerce 2025 is part of Economics Class 11 preparation.
The notes and questions for Mind Map: Presentation of Data have been prepared according to the Commerce exam syllabus. Information about Mind Map: Presentation of Data covers topics
like and Mind Map: Presentation of Data Example, for Commerce 2025 Exam. Find important definitions, questions, notes, meanings, examples, exercises and tests below for Mind Map: Presentation of Data.
Introduction of Mind Map: Presentation of Data in English is available as part of our Economics Class 11
for Commerce & Mind Map: Presentation of Data in Hindi for Economics Class 11 course.
Download more important topics related with notes, lectures and mock test series for Commerce
Exam by signing up for free. Commerce: Mind Map: Presentation of Data | Economics Class 11 - Commerce
Description
Full syllabus notes, lecture & questions for Mind Map: Presentation of Data | Economics Class 11 - Commerce - Commerce | Plus excerises question with solution to help you revise complete syllabus for Economics Class 11 | Best notes, free PDF download
Information about Mind Map: Presentation of Data
In this doc you can find the meaning of Mind Map: Presentation of Data defined & explained in the simplest way possible. Besides explaining types of
Mind Map: Presentation of Data theory, EduRev gives you an ample number of questions to practice Mind Map: Presentation of Data tests, examples and also practice Commerce
tests

Related Searches
Summary
,Previous Year Questions with Solutions
,mock tests for examination
,Important questions
,Mind Map: Presentation of Data | Economics Class 11 - Commerce
,Extra Questions
,Semester Notes
,practice quizzes
,Mind Map: Presentation of Data | Economics Class 11 - Commerce
,Sample Paper
,Mind Map: Presentation of Data | Economics Class 11 - Commerce
,Viva Questions
,Free
,Exam
,study material
,video lectures
,Objective type Questions
,shortcuts and tricks
,MCQs
,ppt
,past year papers
;


Additional Information about Mind Map: Presentation of Data for Commerce Preparation
Mind Map: Presentation of Data Free PDF Download
The Mind Map: Presentation of Data is an invaluable resource that delves deep into the core of the Commerce exam.
These study notes are curated by experts and cover all the essential topics and concepts, making your preparation more efficient and effective.
With the help of these notes, you can grasp complex subjects quickly, revise important points easily,
and reinforce your understanding of key concepts. The study notes are presented in a concise and easy-to-understand manner,
allowing you to optimize your learning process. Whether you're looking for best-recommended books, sample papers, study material,
or toppers' notes, this PDF has got you covered. Download the Mind Map: Presentation of Data now and kickstart your journey towards success in the Commerce exam.
Importance of Mind Map: Presentation of Data
The importance of Mind Map: Presentation of Data cannot be overstated, especially for Commerce aspirants.
This document holds the key to success in the Commerce exam.
It offers a detailed understanding of the concept, providing invaluable insights into the topic.
By knowing the concepts well in advance, students can plan their preparation effectively.
Utilize this indispensable guide for a well-rounded preparation and achieve your desired results.
Mind Map: Presentation of Data Notes
Mind Map: Presentation of Data Notes offer in-depth insights into the specific topic to help you master it with ease.
This comprehensive document covers all aspects related to Mind Map: Presentation of Data.
It includes detailed information about the exam syllabus, recommended books, and study materials for a well-rounded preparation.
Practice papers and question papers enable you to assess your progress effectively.
Additionally, the paper analysis provides valuable tips for tackling the exam strategically.
Access to Toppers' notes gives you an edge in understanding complex concepts.
Whether you're a beginner or aiming for advanced proficiency, Mind Map: Presentation of Data Notes on EduRev are your ultimate resource for success.
Mind Map: Presentation of Data Commerce Questions
The "Mind Map: Presentation of Data Commerce Questions" guide is a valuable resource for all aspiring students preparing for the
Commerce exam. It focuses on providing a wide range of practice questions to help students gauge
their understanding of the exam topics. These questions cover the entire syllabus, ensuring comprehensive preparation.
The guide includes previous years' question papers for students to familiarize themselves with the exam's format and difficulty level.
Additionally, it offers subject-specific question banks, allowing students to focus on weak areas and improve their performance.
Study Mind Map: Presentation of Data on the App
Students of Commerce can study Mind Map: Presentation of Data alongwith tests & analysis from the EduRev app,
which will help them while preparing for their exam. Apart from the Mind Map: Presentation of Data,
students can also utilize the EduRev App for other study materials such as previous year question papers, syllabus, important questions, etc.
The EduRev App will make your learning easier as you can access it from anywhere you want.
The content of Mind Map: Presentation of Data is prepared as per the latest Commerce syllabus.
|
© EduRev
|
Education Revolution
|


|


Signup to see your scores
go up within 7 days!
Access 1000+ FREE Docs, Videos and Tests
Takes less than 10 seconds to signup