Directions: There are Graphics Interpretation questions to complete in this practice test. Carefully review each of the graphs and then choose the best answer from the choices below.
Question for Multi-Source Reasoning Practice Questions - 4
Try yourself:
Assuming the trend in the graph stays the same over the range of workers per supervisor values, if the company were to employ 20 workers per supervisor they would likely be __________ productive than if the company were to employ 160 workers per supervisor.
Explanation
Taking a close look at our curve, we can see that it’s not exactly a bell-curve (with equal rates of decline on either side of the peak) - the rise on the left hand side of the curve is slower than the decline on the right-hand side of the curve. The peak takes place around 100 workers per supervisor, yet 40 workers per supervisor (60 away from the peak value) are just about equally productive as 140 workers per supervisor (40 away from the peak value). If we were to extend a line on the left side of the graph, we will find that at about 30 workers per supervisor, per worker daily production is zero. If we were to extend the trend on the right side of the graph, we will find that at about 155 workers per supervisor,per worker daily production is zero. This suggests that at 160 workers per supervisor, per worker daily production will be negative. Therefore, the company will likely be more productive at 30 workers per supervisor than at 160 workers per supervisor. Choose (B).
Note that extrapolating beyond the range of the data is generally not a good idea and could lead to some nonsensical conclusions. However, since you were asked to assume that the trend stays the same over the range of workers per supervisor values, we can infer that the company will be more productive at 30 workers per supervisor than at 160 workers per supervisor.
Report a problem
Question for Multi-Source Reasoning Practice Questions - 4
Try yourself: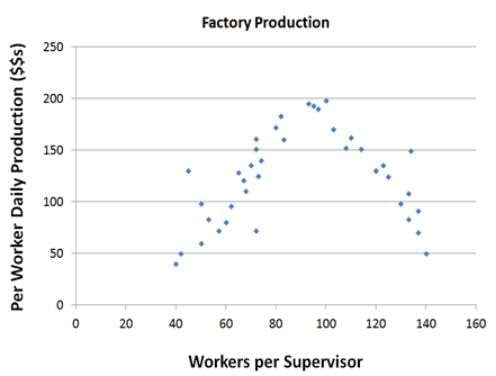
If it wanted to increase productivity, a company currently employing 115 workers per supervisor should consider
Explanation
At 115 workers per supervisor, we are on the sloping down side of the curve, suggesting that we need to have slightly fewer workers per supervisor. The question asks about which option would increase productivity (not necessarily maximize it, just increase it), and since only one option can be right, it must be that three of the options will not increase productivity and only one will.
First option - Adding more workers will mean moving to the right on the curve - more workers per supervisor - which clearly has lower productivity.
Second option - halving the number of supervisors would mean doubling the number of workers per supervisor, to 230, and as per the trend of the graph, this would presumably have lower productivity.
Third option - doubling the number of supervisors would mean that the ratio of workers to supervisor would be halved, to around 57.5 workers per supervisor, which has a lower productivity rate than 115 workers per supervisor.
Fourth option - with 25% fewer workers, the company would have around 87 workers per supervisor. Looking at the curve, although the difference is not huge, this is clearly a more productive ratio than 115 workers per supervisor. Select this final option.
Report a problem
Question for Multi-Source Reasoning Practice Questions - 4
Try yourself: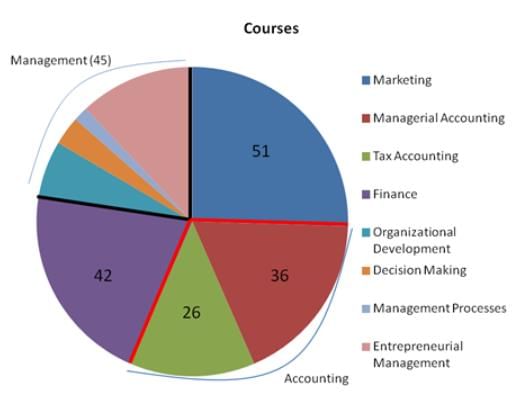
The above pie chart gives the number of course offerings in the business school in the four subject areas: Management, Marketing, Accounting, and Finances, and some of their subareas.
Q. In a geometric progression, each term in the list is obtained by multiplying the previous term by a constant factor. If there are 12 Organizational Development courses, and _______ courses offered in the other subareas of Management, then the course offerings in the subareas of Management could be ordered into a geometric progression.
Explanation
We can see from the chart that there are four subareas in Management, so you can immediately eliminate the options with only 2 other items on the list. A geometric progression means that the next item in the list can be calculated by multiplying the current term by a constant factor.
2, 4, 8, 12 do not form a geometric progression, since 2*2=4, 4*2=8, but 8*2 does not equal 12. 10, 11, 12, 13 are an arithmetic progression, not a geometric progression. In addition, neither of those 2 options sum to 45, as the chart indicates is the total # of courses in Management. However, 3, 6, 12, 24 is a geometric progression (with factor 2), and it correctly sums to 45 total courses. 12, 15, 18 does sum to 45, but it has the wrong number of subareas and it is an arithmetic progression, not a geometric one. 4, 12, 36 is a geometric progression, but it doesn’t sum to 45 and it has the wrong number of subareas.
Report a problem
Question for Multi-Source Reasoning Practice Questions - 4
Try yourself:
The above pie chart gives the number of course offerings in the business school in the four subject areas: Management, Marketing, Accounting, and Finances, and some of their subareas.
Q. A student, randomly selecting two courses, has an approximately ______ chance of selecting one management and one tax accounting course.
Explanation
Remember that you can use a basic calculator for the IR section of the test. In order to randomly select one management and one tax accounting course, there are two possibilities: first selecting a management course and then selecting a tax accounting course, or first selecting a tax accounting course and then selecting a management course.
The overall probability is the sum of these two possible scenarios:
45/200 * 26/199 + 26/200 * 45/199 = 2*45*26/200*199 = 5.9%
If you chose 2.9%, don’t forget to consider both possible orders for selecting the two courses, not just one of them (45/200 * 26/199). If you chose 12.6%, you can’t just square the possibility of selecting either a management or a tax accounting course, because that leaves open the possibility of selecting two of one and neither of the other. If you chose 23.6%, remember that there are 200 total courses, not 100.
Report a problem
Question for Multi-Source Reasoning Practice Questions - 4
Try yourself:
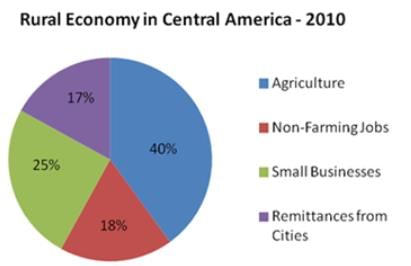
The above pie charts give the percentages of the rural economy in a Central American country for the years 2000 and 2010.
Q. The change in the overall earnings for non-farming jobs plus small businesses between 2000 and 2010
Explanation
The correct answer choice is the fourth one - cannot be determined. Don’t be tricked into just adding up the percentages. The charts give the relative portions of the rural economy made up by these 4 items, but nowhere are we told absolute amounts - what was the overall size of the economy in 2000 and in 2010? This is necessary to then calculate the overall earnings in these particular areas in 2000 versus in 2010. Since we don’t know in which year the overall economy was larger, or if they were the same, we cannot make this comparison.
Report a problem
Question for Multi-Source Reasoning Practice Questions - 4
Try yourself: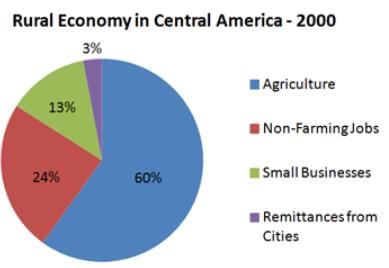

The above pie charts give the percentages of the rural economy in a Central American country for the years 2000 and 2010.
Q. The smallest proportional change in percent between 2000 and 2010 in any segment of the rural economy was in
Explanation
The charts give %s of the rural economy. This question asks about percent change in those percentages. The % of the economy taken up by small businesses nearly doubled in these 10 years, for a percent change of nearly 100%. The % of the economy taken up by remittances increased by nearly 6x in these 10 years, for a percent change of around 467%.
So we can quickly eliminate those two. But agriculture and non-farming jobs both decreased by proportionally similar amounts. Which experienced the smaller percent change? Non-farming jobs decreased by 6/24, or 25%. Agriculture decreased by 20/60, or 1/3, or 33%.
Put in these terms, clearly non-farming jobs experienced a smaller % change than non-farming jobs, since 25% is less than 33%. Select the second option: non-farming jobs.
Report a problem
Question for Multi-Source Reasoning Practice Questions - 4
Try yourself:
The above graph gives the values for 4 items measured by the police department. One represents the number of crimes reported, one represents the number of arrests made, one represents the number of police officers on staff, and one represents the budget surplus for the department (in $1000s).
Q. If the impact of a change enacted by the police department takes a month to register, then we can identify a negative linear relationship between B and
Explanation
If there is a negative linear relationship, that means that when one variable goes up, the other goes down, and vice versa. The new wrinkle introduced by this question is that there can be a one-month lag in seeing this effect. B and D are opposites - when one goes up, the other goes down. If we were to introduce a one-month lag then it’s possible they could correlate directly, not indirectly. With a one-month lag, B and A now seems to be have a negative relationship - when one goes up, the other goes down the following month, and vice versa. But is it a linear relationship - can it be expressed in the form A = mB +c, for some constant values m and c, given a month’s lagtime? You don’t have to do the math, just look at the graph - in the first month, B went up a lot, and in the second month, A went down a little. In the second month, B went down a little, yet in the third month A went up a lot. This is inconsistent - if there’s a linear relationship, then the relative sizes of the changes need to be consistent with each other. Even if you look at the lag in the reverse direction, you’ll notice this same inconsistency.
At this point, you could mark C by process of elimination, but let’s just make sure it works. C shows a decrease in the first 2 months, while B constantly alternates between increases and decreases. So let C lag one month behind B. Between March and April, B has a big increase, and between April and May, C has a relatively large decrease. Between April and May, B has a smaller decrease, and between May and June, C has a smaller increase. Between May and June, B has an increase larger than the decrease but not as large as the first increase, and between June and July, C has a decrease larger than the previous increase but not as large as the first decrease. C is the correct option.
Report a problem
Question for Multi-Source Reasoning Practice Questions - 4
Try yourself: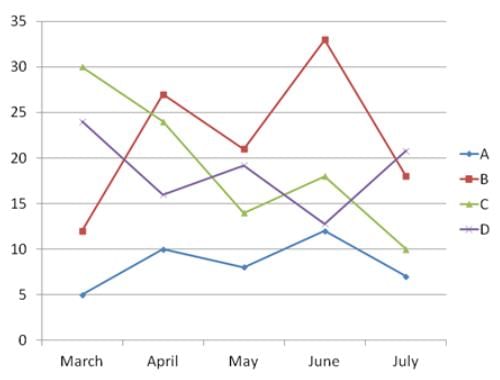
The above graph gives the values for 4 items measured by the police department. One represents the number of crimes reported, one represents the number of arrests made, one represents the number of police officers on staff, and one represents the budget surplus for the department (in $1000s).
Q. Given that each new police officer hired will make multiple arrests, and each new hire will immediately cut into the budget, ____ represents the department’s budget surplus.
Explanation
If each new police officer makes multiple arrests, then the relationship between police officers on staff and arrests will be positive, and the total number of arrests will be greater than the total number of police officers. Looking at our graph, that could only mean that A is # of police officers and B is # of arrests. Every new police officer hired lowers the budget surplus, so there will be a negative relationship between A and the variable representing the surplus. Since C and A both decrease between April and May, this can only be D. Select the final option, D.
Report a problem