Class 6 Exam  >  Class 6 Notes  >  Mathematics (Maths) Class 6  >  NCERT Solutions: Data Handling

NCERT Solutions for Class 6 Maths - Data Handling

Exercise 9.1 

Q1. In a Mathematics test, the following marks were obtained by 40 students. Arrange these marks in a table using tally marks.
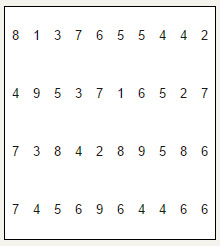
NCERT Solutions for Class 6 Maths - Data Handling

(a) Find how many students obtained marks equal to or more than 7.
(b) How many students obtained marks below 4?
Ans:
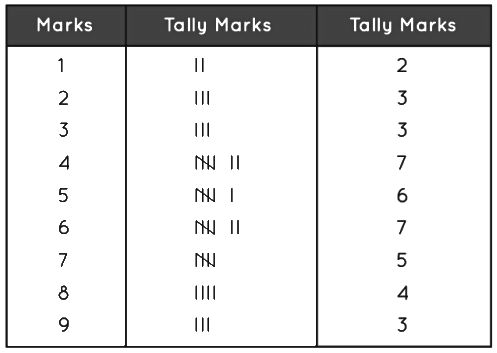
Marks

Tally Marks

No. of students

1

  II

2

2

  III

3

3

  III

3

4

NCERT Solutions for Class 6 Maths - Data Handling

7

5

NCERT Solutions for Class 6 Maths - Data Handling

6

6

NCERT Solutions for Class 6 Maths - Data Handling

7

7

NCERT Solutions for Class 6 Maths - Data Handling

5

8

  IIII

4

9

  III

3

(a) The students who got marks equal to or more than 7 are the students who got marks 7, 8 or 9. Therefore the number of these students are:
= 5 + 4 + 3
= 12
(b) The students who got marks below 4 are the students who got marks 1,2 or 3. Therefore the number of these students are:
= 2 + 3 + 3
= 8


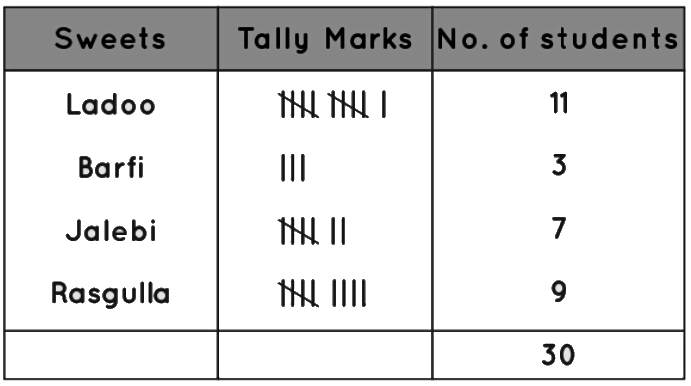
Q2. Following is the choice of sweets of 30 students of Class VI.
Ladoo, Barfi, Ladoo, Jalebi, Ladoo, Rasgulla, Jalebi, Ladoo, Barfi, Rasgulla, Ladoo, Jalebi, Jalebi, Rasgulla, Ladoo, Rasgulla, Jalebi, Ladoo, Rasgulla, Laddo, Ladoo, Barfi, Rasgulla, Rasgulla, Jalebi, Rasgulla, Ladoo, Rasgulla, Jalebi, Ladoo.
(a) Arrange the names of sweets in a table using tally marks.
(b) Which sweet is preferred by most of the students?
Ans: 
(a) Table using tally marks:
Sweets

Tally Marks

No. of students

Ladoo

NCERT Solutions for Class 6 Maths - Data Handling

11

Barfl

NCERT Solutions for Class 6 Maths - Data Handling

3

jalebi

NCERT Solutions for Class 6 Maths - Data Handling

7

Rasgulla

NCERT Solutions for Class 6 Maths - Data Handling

9


30

(b) The sweet which is preferred by most of the students is Ladoo. As out of 30, 11 students prefer eating ladoo.


Q3. Catherine threw a dice 40 times and noted the number appearing each time as shown below:
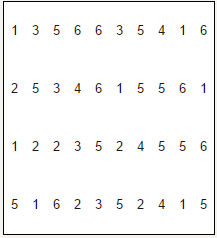
NCERT Solutions for Class 6 Maths - Data Handling
Make a table and enter the data using tally marks. Find the number that appeared.
(a) The minimum number of times
(b) The maximum number of times
(c) Find those numbers that appear an equal number of times.
Ans:  
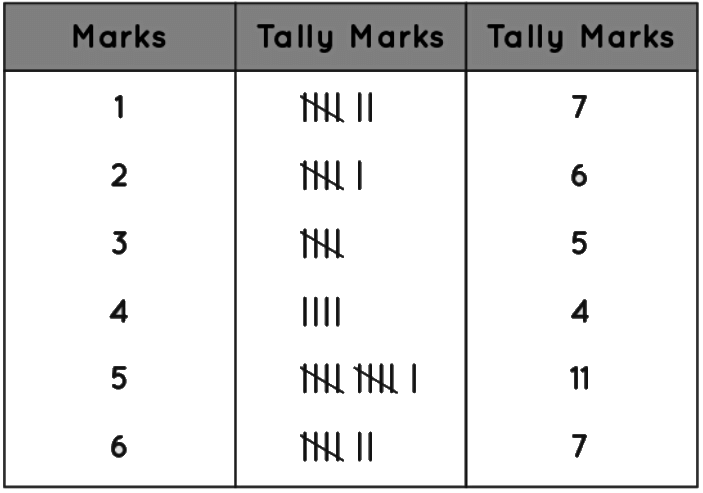
Numbers

Tally Marks

How many times?

1

NCERT Solutions for Class 6 Maths - Data Handling

7

2

NCERT Solutions for Class 6 Maths - Data Handling

6

3

NCERT Solutions for Class 6 Maths - Data Handling

5

4

NCERT Solutions for Class 6 Maths - Data Handling

4

5

NCERT Solutions for Class 6 Maths - Data Handling

11

6

NCERT Solutions for Class 6 Maths - Data Handling

7

(a) The number that occurred for minimum number of times is 4
(b) The number that occurred for maximum number of times is 5
(c) 1 and 6 are the numbers that appear an equal number of times.


Q4. Following pictograph shows the number of tractors in five villages. 

Village

Number of tractors NCERT Solutions for Class 6 Maths - Data Handling = 1 Tractor

Village A

NCERT Solutions for Class 6 Maths - Data Handling

Village B

NCERT Solutions for Class 6 Maths - Data Handling

Village C

NCERT Solutions for Class 6 Maths - Data Handling

Village D

NCERT Solutions for Class 6 Maths - Data Handling

Village E

NCERT Solutions for Class 6 Maths - Data Handling

Observe the pictograph and answer the following questions: 
(i) Which village has the minimum number of tractors? 
(ii) Which village has the maximum number of tractors? 
(iii) How many more tractors village C has as compared to village B. 
(iv) What is the total number of tractors in all the five villages? 
Ans: 
(i) Village D has the minimum number of tractors.
(ii) Village C has the maximum number of tractors.
(iii) Village B has 5 tractors
Village C has 8 tractors
= 8 - 5
= 3 Tractors
Village C has 3 more tractors as compared to village B.
(iv) Total number of tractors in all the villages = 6 + 5 + 8 + 3 + 6 = 28 tractors


Q5. The number of girl students in each class of a co-educational middle school is depicted by the pictograph: 

Class

Number of girl students NCERT Solutions for Class 6 Maths - Data Handling - 4 girls

INCERT Solutions for Class 6 Maths - Data Handling

II

NCERT Solutions for Class 6 Maths - Data Handling

III

NCERT Solutions for Class 6 Maths - Data Handling

IV

NCERT Solutions for Class 6 Maths - Data Handling

Observe this pictograph and answer the following questions:
(a) Which class has the minimum number of girl students?
(b) Is the number of girls in Class VI less than the number of girls in Class V?
(c) How many girls are there in Class VII?
Ans: (a) Class VIII has only 6 girls. Therefore, the minimum number of girl students are in Class VIII.
(b) No. Class V has 10 girl students and Class VI has 16 girl students. Therefore, the number of girls in Class VI are more than the number of girls in Class V.
(c) The number of girls in Class VII are 12.


Q6. The sale of electric bulbs on different days of a week is shown below:

Day

Number of electric bulbs NCERT Solutions for Class 6 Maths - Data Handling - 2 bulbs

Monday

NCERT Solutions for Class 6 Maths - Data Handling

Tuesday

NCERT Solutions for Class 6 Maths - Data Handling

Wednesday

NCERT Solutions for Class 6 Maths - Data Handling

Thursday

NCERT Solutions for Class 6 Maths - Data Handling

Friday

NCERT Solutions for Class 6 Maths - Data Handling

Saturday

NCERT Solutions for Class 6 Maths - Data Handling

Sunday

NCERT Solutions for Class 6 Maths - Data Handling

Observe the pictograph and answer the following questions: 
(a) How many bulbs were sold on Friday? 
(b) On which day were the maximum number of bulbs sold? 
(c) On which of the days same number of bulbs were sold? 
(d) On which of the days minimum number of bulbs were sold? 
(e) If one big carton can hold 9 bulbs. How many cartons were needed in the given week? 
Ans: 
(a) Number of bulbs sold on Friday are 14.
(b) Maximum number of bulbs (18) were sold on Sunday.
(c) On Wednesday and Saturday 8 bulbs are sold. Hence equal number of bulbs were sold on Wednesday and Saturday.
(d) The minimum number of bulbs (8) were sold on Wednesday and Saturday.
(e) The total number of bulbs sold in the given week were 86. So the number of carton required to hold 86 bulb = 86/9 ≈10. Hence, 10 cartons required to hold the bulbs.


Q7. In a village, six fruit merchants sold the following number of fruit baskets in a particular season:

Name of fruit merchant

Number of fruit baskets NCERT Solutions for Class 6 Maths - Data Handling -100 fruit basket s

Rahim

NCERT Solutions for Class 6 Maths - Data Handling

Lakhanpal

NCERT Solutions for Class 6 Maths - Data Handling

Anwar

NCERT Solutions for Class 6 Maths - Data Handling

Martin

NCERT Solutions for Class 6 Maths - Data Handling

Ranjit Singh

NCERT Solutions for Class 6 Maths - Data Handling

Joseph

NCERT Solutions for Class 6 Maths - Data Handling

Observe this pictograph and answer the following question:
(a) Which merchant sold the maximum number of baskets?
(b) How many fruit baskets were sold by Anwar?
(c) The merchants who have sold 600 or more number of baskets are planning to buy a godown for the next season. Can you name them?
Ans: 
(a) Martin sold the maximum number of fruit baskets i.e. 950.
(b) Anwar sold 700 fruit basket
(c) Anwar, Martin, Ranjit Singh are the merchants who sold more than 600 fruit baskets. Hence, these are the merchants who are planning to buy a godown for the next season. 


Exercise 9.2 (Old NCERT)

Question 1) 

Total number of animals in five villages are as follows: 

Village A : 80 

Village B : 120 

Village C : 90 

Village D : 40 

Village E : 60 

Prepare a pictograph of these animals using one symbol to represent 10 animals and answer the following questions: 

(a) How many symbols represent animals of village E? 

(b) Which village has the maximum number of animals? 

(c) Which village has more animals: village A or village C? 

Answer 1:

VillageNumber of animals       NCERT Solutions for Class 6 Maths - Data Handling=10 animals

Village A

NCERT Solutions for Class 6 Maths - Data Handling

Village B

NCERT Solutions for Class 6 Maths - Data Handling

Village C

NCERT Solutions for Class 6 Maths - Data Handling

Village D

NCERT Solutions for Class 6 Maths - Data Handling

Village E

NCERT Solutions for Class 6 Maths - Data Handling

(a) There are 60 animals in village E. So 6 symbols represent animals of village E.

(b) Village B has 120 animals which is the maximum number among these villages.

(c) Village A has 80 animals and village C has 90 animals. Clearly, Village C has more animals than Village A.


Question 2)

Total number of students of a school in different years is shown in the following table

Year

Number of students

1996

400

1998

535

2000

472

2002

600

2004

623

A. Prepare a pictograph of students using one symbol NCERT Solutions for Class 6 Maths - Data Handling to represent 100 students and answer the following questions:

(a) How many symbols represent total number of students in the year 2002?

(b) How many symbols represent total number of students for the year 1998?

B. Prepare another pictograph of students using any other symbol each representing 50 students. Which pictograph do you find more informative?

Answer 2: 

Years

100 students =  NCERT Solutions for Class 6 Maths - Data Handling

1996

NCERT Solutions for Class 6 Maths - Data Handling

1998

NCERT Solutions for Class 6 Maths - Data Handling

2000

NCERT Solutions for Class 6 Maths - Data Handling

2002

NCERT Solutions for Class 6 Maths - Data Handling

2004

NCERT Solutions for Class 6 Maths - Data Handling

(a) Total number of students in the year 2002 represents 6 symbols. 

(b) Total number of students in the year 1998 represents 5 complete and 1 incomplete symbols.


B. 

Years

50 students  = NCERT Solutions for Class 6 Maths - Data Handling

1996

NCERT Solutions for Class 6 Maths - Data Handling

1998

NCERT Solutions for Class 6 Maths - Data Handling

2000

NCERT Solutions for Class 6 Maths - Data Handling

2002

NCERT Solutions for Class 6 Maths - Data Handling

2004

NCERT Solutions for Class 6 Maths - Data Handling

Pictograph B is more informative than A.


Exercise 9.3 

(Old NCERT)

Question 1)

The bar graph given alongside shows the amount of wheat purchased by government during the year 1998-2002.

NCERT Solutions for Class 6 Maths - Data Handling

Read the bar graph and write down your observations. In which year was

(a) the wheat production maximum?

(b) the wheat production minimum?

Answer 1: 

(a) In 2002, production of wheat was maximum.

(b) In 1998, production of wheat was minimum.


Question 2)

Observe this bar graph which is showing the sale of shirts in a ready made shop from Monday to Saturday.

NCERT Solutions for Class 6 Maths - Data Handling

Now answer the following questions:

(a) What information does the above bar graph give?

(b) What is the scale chosen on the horizontal line representing number of shirts?

(c) On which day was the maximum number of shirts sold? How many shirts were sold on that day?

(d) On which day was the minimum number shirts sold?

(e) How many shirts were sold on Thursday?

Answer 2: 

(a) The bar graph shows the sale of shirt in a readymade shop from Monday to Saturday.

(b) 1 unit = 5 shirts is the scale on the horizontal line representing number of shirts.

(c) On Saturday maximum number of shirts i.e. 60 shirts were sold.

(d) On Tuesday minimum number of shirts i.e. 10 were sold.

(e) On Tuesday 35 shirts were sold.


Question 3)

Observe this bar graph which shows the marks obtained by Aziz in half-yearly examination in different subjects.

NCERT Solutions for Class 6 Maths - Data Handling

Answer the given questions.

(a) What information does the bar graph give?

(b) Name the subject in which Aziz scored maximum marks.

(c) Name the subject in which he has scored minimum marks.

(d) State the name of the subjects and marks obtained in each of them.

Answer 3: 

(a) The bar graph shows the marks obtained by Aziz in half yearly examination in different subjects.

(b) Aziz scored maximum marks in Hindi i.e. 80 marks.

(c) Aziz scored minimum marks in Social Studies i.e. 40 marks.

(d) Hindi 80, English 60, Mathematics 70, Science 50, Social Studies 40.


Exercise 9.4 (Old NCERT)

Question 1)

A survey of 120 school students was done to find which activity they prefer to do in their free time.

Preferred activity

Number of students

Playing

45

Reading story books

30

Watching TV

20

Listening to music

10

Painting

15


Draw a bar graph to illustrate the above data taking scale of 1 unit length = 5 students. Which activity is preferred by most of the students other than playing?

Answer 1:

NCERT Solutions for Class 6 Maths - Data Handling

Reading story books is the activity preferred by most of the students other than playing.


Question 2)

The number of Mathematics books sold by a shopkeeper on six consecutive days is shown below:

Days

Number of books sold

Sunday

65

Monday

40

Tuesday

30

Wednesday

50

Thursday

20

Friday

70

Draw a bar graph to represent the above information choosing the scale of your choice.

Answer 2:

NCERT Solutions for Class 6 Maths - Data Handling


Question 3)

Following table shows the number of bicycles manufactured in a factory during the years 1998 to 2002. Illustrate this data using a bar graph. Choose a scale of your choice. 

Years

Number of bicycles manufactured

1998

800

1999

600

2000

900

2001

1100

2002

1200

(a) In which year was the maximum number of bicycles manufactured?

(b) In which year was the minimum number of bicycles manufactured?

Answer 3:

NCERT Solutions for Class 6 Maths - Data Handling

(a) The maximum number of bicycles were manufactured in 2002.

(b) The minimum number of bicycles were manufactured in 1999.

Question 4)

Number of persons in various age groups in a town is given in the following table.

Age group

1 - 14

15-29

30 - 44

45-59

60 -74

75 & above

Number of persons

2 lakhs

1 lakhs

60 thousands

1 lakh

20 thousands

1 lakh

20 thousands

80

40

Thousands

Draw a bar graph to represent the above information and answer the following questions. (take 1 unit length = 20 thousands)

(a) Which two age groups have same population?

(b) All persons in the age group of 60 and above are called senior citizens. How many senior citizens are there in the town?

Answer 4:

NCERT Solutions for Class 6 Maths - Data Handling

(a) Group 30 – 44 and group 45 – 59 have the same population.

(b) Senior citizens are the persons between the age group either from 60 - 74 or from 75 above. Therefore, 

      Number of senior citizens in town = 80000 + 40000

      = 1 lakh 20 thousand

The document NCERT Solutions for Class 6 Maths - Data Handling is a part of the Class 6 Course Mathematics (Maths) Class 6.
All you need of Class 6 at this link: Class 6
94 videos|347 docs|54 tests

Top Courses for Class 6

FAQs on NCERT Solutions for Class 6 Maths - Data Handling

1. What is data handling?
Ans. Data handling refers to the process of collecting, organizing, analyzing, and interpreting data to make useful conclusions or decisions. It involves various techniques and tools to manage data effectively.
2. Why is data handling important in today's world?
Ans. Data handling is crucial in today's world as it helps in making informed decisions, understanding patterns and trends, identifying problems, and finding solutions. It is widely used in various fields such as business, healthcare, education, and research to improve efficiency and effectiveness.
3. What are the different methods of data handling?
Ans. There are several methods of data handling, including data collection, data organization, data analysis, and data interpretation. Data can be collected through surveys, experiments, observations, or by accessing existing databases. It is then organized using tables, graphs, or charts. Analysis techniques such as statistical analysis or data mining are applied to extract meaningful insights, and finally, the data is interpreted to draw conclusions.
4. How can data handling be used in business?
Ans. Data handling plays a crucial role in business as it helps in understanding customer behavior, market trends, and identifying opportunities for growth. It can be used to analyze sales data, customer feedback, website analytics, and social media data to make informed decisions and improve business strategies. Data handling also aids in risk assessment, fraud detection, and performance evaluation.
5. What are the challenges in data handling?
Ans. Data handling faces various challenges, including data quality issues, data privacy concerns, and data security risks. Ensuring the accuracy and reliability of data is essential for meaningful analysis. Protecting sensitive information and complying with data protection regulations is crucial. Additionally, handling large volumes of data (big data) and dealing with data from multiple sources can be challenging.
94 videos|347 docs|54 tests
Download as PDF
Explore Courses for Class 6 exam

Top Courses for Class 6

Signup for Free!
Signup to see your scores go up within 7 days! Learn & Practice with 1000+ FREE Notes, Videos & Tests.
10M+ students study on EduRev
Related Searches

Previous Year Questions with Solutions

,

NCERT Solutions for Class 6 Maths - Data Handling

,

mock tests for examination

,

shortcuts and tricks

,

Objective type Questions

,

Important questions

,

NCERT Solutions for Class 6 Maths - Data Handling

,

Summary

,

past year papers

,

Extra Questions

,

study material

,

Semester Notes

,

Exam

,

Free

,

NCERT Solutions for Class 6 Maths - Data Handling

,

video lectures

,

MCQs

,

Sample Paper

,

practice quizzes

,

Viva Questions

,

pdf

,

ppt

;