Pie Charts | Know Your Aptitude Class 6 To 8 - Class 8 PDF Download
| Table of contents |

|
| What is a Pie Chart? |

|
| Formula |

|
| How to Create a Pie Chart? |

|
| Uses of Pie Chart |

|
| Advantages of Pie Chart |

|
| Disadvantages of Pie Chart |

|
What is a Pie Chart?
The “pie chart” is also known as a “circle chart”, dividing the circular statistical graphic into sectors or sections to illustrate the numerical problems. Each sector denotes a proportionate part of the whole. To find out the composition of something, Pie-chart works the best at that time. In most cases, pie charts replace other graphs like the bar graph, line plots, histograms, etc.
Formula
The pie chart is an important type of data representation. It contains different segments and sectors in which each segment and sector of a pie chart forms a specific portion of the total(percentage). The sum of all the data is equal to 360°.
The total value of the pie is always 100%.
To work out with the percentage for a pie chart, follow the steps given below:
- Categorize the data
- Calculate the total
- Divide the categories
- Convert into percentages
- Finally, calculate the degrees
Therefore, the pie chart formula is given as:
(Given Data/Total value of Data) × 360°
Note: It is not mandatory to convert the given data into percentages until it is specified. We can directly calculate the degrees for given data values and draw the pie chart accordingly.
How to Create a Pie Chart?
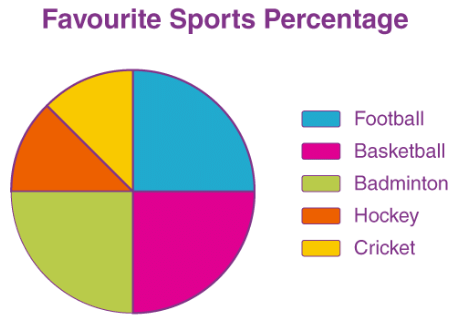
Imagine a teacher surveys her class on the basis of favourite Sports of students:
The data above can be represented by a pie chart as following and by using the circle graph formula, i.e. the pie chart formula given below. It makes the size of the portion easy to understand.
Step 1: First, Enter the data into the table.

Step 2: Add all the values in the table to get the total.
i.e. Total students are 40 in this case.
Step 3: Next, divide each value by the total and multiply by 100 to get a per cent:
Step 4: Next to know how many degrees for each “pie sector” we need, we will take a full circle of 360° and follow the calculations below:
The central angle of each component = (Value of each component/sum of values of all the components) ✕ 360° Now you can draw a pie chart.
Step 5: Draw a circle and use the protractor to measure the degree of each sector.
Uses of Pie Chart
- Within a business, it is used to compare areas of growth, such as turnover, profit and exposure.
- To represent categorical data.
- To show the performance of a student in a test, etc.
Advantages of Pie Chart
- The picture is simple and easy-to-understand
- Data can be represented visually as a fractional part of a whole
- It helps in providing an effective communication tool for the even uninformed audience
- Provides a data comparison for the audience at a glance to give an immediate analysis or to quickly understand information
- No need for readers to examine or measure underlying numbers themselves, which can be removed by using this chart
- To emphasize a few points you want to make, you can manipulate pieces of data in the pie chart
Disadvantages of Pie Chart
- It becomes less effective if there are too many pieces of data to use
- If there are too many pieces of data. Even if you add data labels and numbers may not help here, they themselves may become crowded and hard to read
- As this chart only represents one data set, you need a series to compare multiple sets
- This may make it more difficult for readers when it comes to analyze and assimilate information quickly
|
5 videos|60 docs|13 tests
|


