
Best Study Material for NEET Exam
NEET Exam > NEET Notes > Biology Class 12 > Population Attributes & Growth
Population Attributes & Growth | Biology Class 12 - NEET PDF Download
| Table of contents |
|
| Population Attributes |
|
| Population Growth |
|
| Growth Models |
|
| (i) Exponential Growth |
|
| (ii) Logistic Growth |
|
| Life History Variation |
|
Population Attributes
- In nature, most individuals of a species are found living in groups within a specific geographical area. These individuals share or compete for similar resources and have the potential to interbreed, thus forming a population. While interbreeding typically refers to sexual reproduction, groups of individuals resulting from asexual reproduction are also considered populations for ecological studies. Examples of populations include all the cormorants in a wetland, rats in an abandoned dwelling, teakwood trees in a forest, bacteria in a culture plate, and lotus plants in a pond.
- Population ecology is crucial because it connects ecology with population genetics and evolution. Although individual organisms must adapt to environmental changes, natural selection operates at the population level to evolve desired traits. Populations have specific attributes that individuals do not. For instance, while an individual may experience births and deaths, a population has birth rates and death rates, which are expressed as per capita rates. These rates indicate changes in numbers (increase or decrease) concerning the members of the population.
(i) Birth and Death Rates
Birth and death rates are crucial attributes of a population. While an individual organism may experience births and deaths, a population is characterized by birth rates and death rates, which are expressed per capita. These rates reflect the change in numbers (increase or decrease) concerning the members of the population.
Example:
- Birth Rate: Imagine a pond with 20 lotus plants last year. If 8 new plants are added through reproduction, the current population becomes 28. The birth rate is calculated as 8/20 = 0.4 offspring per lotus per year.
- Death Rate: In a laboratory population of 40 fruit flies, if 4 individuals die during a specified time interval (e.g., a week), the death rate is 4/40 = 0.1 individuals per fruit fly per week.
(ii) Sex Ratio
A population's sex ratio indicates the proportion of males and females within it. For instance, if 60 percent of the population are females and 40 percent are males, this distribution reflects the sex ratio of the population.
(iii) Age Distribution and Age Pyramid
 Representation of age pyramids for human population
- Age Distribution: The age distribution of a population, represented as the percentage of individuals of different ages or age groups, provides insights into the population's structure.
- Age Pyramid: A graphical representation of age distribution is called an age pyramid. For human populations, age pyramids typically display the age distribution of males and females. The shape of the pyramid indicates whether the population is growing, stable, or declining.
(iv) Population Size and Population Density
- Population Size: The total number of individuals in a population at a given time.
- Population Density (N): Population size can be expressed as population density, which may not always be measured in numbers. While total number is often the most appropriate measure, there are instances where it is meaningless or challenging to determine.
(v) Relative Measures and Indirect Estimation
- In some cases, relative measures of population size are sufficient. For instance, the number of fish caught per trap can indicate the total population density in a lake.
- Estimating population sizes indirectly is common. For example, tiger censuses in national parks and reserves often rely on pug marks and fecal pellets rather than direct counting.
Understanding these population attributes is essential for studying ecological processes, such as competition with other species, the impact of predators, or the effects of pesticide applications, all evaluated in terms of changes in population size.
Question for Population Attributes & Growth
Try yourself:
Which of the following population attributes is represented by the proportion of males and females within a population?View Solution
Population Growth
Population growth refers to the change in the number of individuals in a population over time. It is influenced by factors such as birth rates, death rates, immigration, and emigration. Understanding these factors helps us analyze whether a population is increasing, decreasing, or stable.
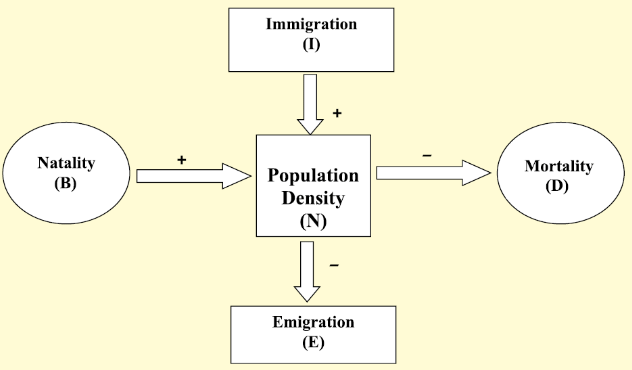
Key Processes in Population Density Changes
Population density varies over time due to factors like food availability, predation, and weather.Changes in density indicate whether a population is thriving or declining.
Four basic processes affect population density:
- Natality: Number of births in a given period.
- Mortality: Number of deaths in a given period.
- Immigration: Individuals moving into a habitat from elsewhere.
- Emigration: Individuals leaving a habitat.
Population Density Equation
 Population Density Key Processes
So, if N is the population density at time t, then its density at time t +1 is
Nt+1 = Nt + [(B + I) – (D + E)]
- Population density increases when births plus immigrants (B + I) exceed deaths plus emigrants (D + E).
- Under normal conditions, births and deaths are the main factors influencing population density.
- Immigration and emigration play a bigger role in specific situations, such as when a new habitat is being colonized.
Growth Models
Understanding how populations grow over time can help us learn about controlling population growth.
There are two main models to explain how populations grow:
(i) Exponential Growth
Exponential growth occurs when a population increases rapidly over time without any limits on resources like food and space.
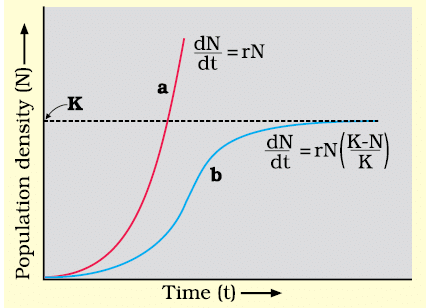 Population growth curve a when responses are not limiting the growth, plot is exponential, b when responses are limiting the growth, plot is logistic, K is carrying capacity
Key Equation: The change in population size over time can be expressed with the formula:
dN/dt = (b - d) × N where:
dN/dt: Change in population size over time
b: Birth rate
d: Death rate
N: Population size
Intrinsic Rate of Natural Increase (r): This is a crucial factor in understanding population growth. It is calculated as r = b - d. For example, the Norway rat has an r value of 0.015, the flour beetle 0.12, and in 1981, India's human population had an r value of 0.0205.
J-shaped Curve: When plotted on a graph, exponential growth creates a J-shaped curve, indicating rapid population increase over time.
Integral Form: The integral form of the exponential growth equation is:
Nt = N0ert
where:Nt: Population density after time t
N0: Population density at time zero
r: Intrinsic rate of natural increase
e: Base of natural logarithms (approximately 2.71828)
Anecdote: To illustrate exponential growth, consider the story of a king and a minister playing chess. The minister bets on receiving wheat grains placed on the chessboard in a doubling pattern. This story highlights how quickly populations can grow when resources are unlimited, similar to how a tiny organism like Paramecium could multiply rapidly under ideal conditions.
Question for Population Attributes & Growth
Try yourself:
Which of the following factors does NOT influence population growth?View Solution
 |
Download the notes
Population Attributes & Growth
|
Download as PDF |
Download as PDF
(ii) Logistic Growth
- No population in nature has unlimited resources for exponential growth, leading to competition for limited resources.
- The ‘fittest’individuals survive and reproduce.
- Carrying Capacity (K): A habitat can support only a maximum number of individuals, called the carrying capacity (K).
- Phases of Growth: Initial lag phase, followed by phases of acceleration and deceleration, eventually reaching an asymptote when the population density hits K.
- Sigmoid Curve: A plot of population (N) against time (t) results in a sigmoid curve, indicative of logistic growth.
- Verhulst-Pearl Logistic Growth: Described by the equation:
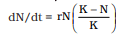
- Where: N = Population density at time t,r = Intrinsic rate of natural increase,K = Carrying capacity.
- Logistic growth is considered more realistic because resources for growth are finite and become limiting over time.
- Government Census Data: Gather and plot population figures for India over the last 100 years to observe the evident growth pattern.
 |
Take a Practice Test
Test yourself on topics from NEET exam
|
Practice Now |
Practice Now
Life History Variation
- Populations evolve to maximize their reproductive fitness(high r value) in their specific habitat.
- Organisms evolve efficient reproductive strategies under particular selection pressures.
- Some organisms breed only once in their lifetime (e.g., Pacific salmon, bamboo), while others breed multiple times (e.g., most birds and mammals).
- Some produce a large number of small offspring (e.g., oysters, pelagic fishes), while others produce a small number of large offspring (e.g., birds, mammals).
- The desirability of breeding strategies for maximizing fitness depends on the constraints imposed by abiotic and biotic components of the habitat.
- The evolution of life history traits in different species is a significant area of research forecologists.
Question for Population Attributes & Growth
Try yourself:
Which of the following is a characteristic of logistic growth in a population?View Solution
The document Population Attributes & Growth | Biology Class 12 - NEET is a part of the NEET Course Biology Class 12.
All you need of NEET at this link: NEET
|
78 videos|280 docs|174 tests
|


FAQs on Population Attributes & Growth - Biology Class 12 - NEET
| 1. What is exponential growth in population dynamics? |  |
| 2. How does logistic growth differ from exponential growth? | |
Ans.Logistic growth differs from exponential growth in that it accounts for environmental limitations. While exponential growth continues unchecked, logistic growth shows a population increasing rapidly at first but then slowing as it approaches the carrying capacity of the environment. This results in an S-shaped curve, reflecting the balance between growth and resource limits.
| 3. What factors influence population growth rates? | |
Ans.Factors influencing population growth rates include birth rates, death rates, immigration, and emigration. Additionally, environmental conditions, availability of resources, predation, disease, and competition also play significant roles in determining how quickly a population can grow or decline.
| 4. What is the concept of carrying capacity in logistic growth? | |
Ans.Carrying capacity is the maximum population size that an environment can sustain indefinitely without degrading the habitat. In logistic growth, as a population approaches its carrying capacity, the growth rate slows down due to increased competition for limited resources, leading to a stabilization of the population size.
| 5. How do life history traits affect population growth? | |
Ans.Life history traits, such as age at first reproduction, number of offspring, and lifespan, significantly affect population growth. Species with short lifespans and high reproductive rates (r-strategists) can grow rapidly, while those with longer lifespans and fewer offspring (K-strategists) grow more slowly and can be more stable in fluctuating environments.
About this Document

4.88/5
Rating

Feb 24, 2025
Last updated
Document Description: Population Attributes & Growth for NEET 2025 is part of Biology Class 12 preparation.
The notes and questions for Population Attributes & Growth have been prepared according to the NEET exam syllabus. Information about Population Attributes & Growth covers topics
like Population Attributes, Population Growth, Growth Models, (i) Exponential Growth, (ii) Logistic Growth, Life History Variation and Population Attributes & Growth Example, for NEET 2025 Exam. Find important definitions, questions, notes, meanings, examples, exercises and tests below for Population Attributes & Growth.
Introduction of Population Attributes & Growth in English is available as part of our Biology Class 12
for NEET & Population Attributes & Growth in Hindi for Biology Class 12 course.
Download more important topics related with notes, lectures and mock test series for NEET
Exam by signing up for free. NEET: Population Attributes & Growth | Biology Class 12 - NEET
Description
Full syllabus notes, lecture & questions for Population Attributes & Growth | Biology Class 12 - NEET - NEET | Plus excerises question with solution to help you revise complete syllabus for Biology Class 12 | Best notes, free PDF download
Information about Population Attributes & Growth
In this doc you can find the meaning of Population Attributes & Growth defined & explained in the simplest way possible. Besides explaining types of
Population Attributes & Growth theory, EduRev gives you an ample number of questions to practice Population Attributes & Growth tests, examples and also practice NEET
tests

Related Searches
past year papers
,Previous Year Questions with Solutions
,mock tests for examination
,Extra Questions
,practice quizzes
,Free
,study material
,Objective type Questions
,Important questions
,Summary
,Population Attributes & Growth | Biology Class 12 - NEET
,Sample Paper
,video lectures
,Population Attributes & Growth | Biology Class 12 - NEET
,MCQs
,shortcuts and tricks
,Exam
,Population Attributes & Growth | Biology Class 12 - NEET
,ppt
,Semester Notes
,Viva Questions
;


Additional Information about Population Attributes & Growth for NEET Preparation
Population Attributes & Growth Free PDF Download
The Population Attributes & Growth is an invaluable resource that delves deep into the core of the NEET exam.
These study notes are curated by experts and cover all the essential topics and concepts, making your preparation more efficient and effective.
With the help of these notes, you can grasp complex subjects quickly, revise important points easily,
and reinforce your understanding of key concepts. The study notes are presented in a concise and easy-to-understand manner,
allowing you to optimize your learning process. Whether you're looking for best-recommended books, sample papers, study material,
or toppers' notes, this PDF has got you covered. Download the Population Attributes & Growth now and kickstart your journey towards success in the NEET exam.
Importance of Population Attributes & Growth
The importance of Population Attributes & Growth cannot be overstated, especially for NEET aspirants.
This document holds the key to success in the NEET exam.
It offers a detailed understanding of the concept, providing invaluable insights into the topic.
By knowing the concepts well in advance, students can plan their preparation effectively.
Utilize this indispensable guide for a well-rounded preparation and achieve your desired results.
Population Attributes & Growth Notes
Population Attributes & Growth Notes offer in-depth insights into the specific topic to help you master it with ease.
This comprehensive document covers all aspects related to Population Attributes & Growth.
It includes detailed information about the exam syllabus, recommended books, and study materials for a well-rounded preparation.
Practice papers and question papers enable you to assess your progress effectively.
Additionally, the paper analysis provides valuable tips for tackling the exam strategically.
Access to Toppers' notes gives you an edge in understanding complex concepts.
Whether you're a beginner or aiming for advanced proficiency, Population Attributes & Growth Notes on EduRev are your ultimate resource for success.
Population Attributes & Growth NEET Questions
The "Population Attributes & Growth NEET Questions" guide is a valuable resource for all aspiring students preparing for the
NEET exam. It focuses on providing a wide range of practice questions to help students gauge
their understanding of the exam topics. These questions cover the entire syllabus, ensuring comprehensive preparation.
The guide includes previous years' question papers for students to familiarize themselves with the exam's format and difficulty level.
Additionally, it offers subject-specific question banks, allowing students to focus on weak areas and improve their performance.
Study Population Attributes & Growth on the App
Students of NEET can study Population Attributes & Growth alongwith tests & analysis from the EduRev app,
which will help them while preparing for their exam. Apart from the Population Attributes & Growth,
students can also utilize the EduRev App for other study materials such as previous year question papers, syllabus, important questions, etc.
The EduRev App will make your learning easier as you can access it from anywhere you want.
The content of Population Attributes & Growth is prepared as per the latest NEET syllabus.
|
© EduRev
|
Education Revolution
|


|


Signup on EduRev and stay on top of your study goals
10M+ students crushing their study goals daily