Population & Sample | Applied Mathematics for Class 12 - Commerce PDF Download
| Table of contents |

|
| What is the population? |

|
| Sample |

|
| Probability Sampling |

|
| Population and Sample Examples |

|
| Population and Sample Formula |

|
| Difference between Population and Sample |

|
What is the population?
The population includes all the elements of the data set and measurable terms of the population like mean, and standard deviation which is known as parameters. Population refers to the entire group of people, objects, events, etc. There are different types of populations that we will discuss in detail.
- Finite population
- Infinite population
- Existent population
- Hypothetical population.
Now a detailed explanation about population and sample is given below.
Sample
The sample is part of the population. The sample includes one or two observations that are extracted from the population. The characteristic that can be measured, of the sample, is called a statistic. The process of selecting samples from the population is known as sampling. For example, some students in the class are the sample of the population. The sampling process is divided into two types they are,
- Probability sampling,
- Nonprobability sampling.
We will discuss both types in detail and will try to understand them.
Probability Sampling
Probability sampling is based on the fact that every member of the population has equal chances of being selected. In probability sampling, the population unit cannot be selected at the discretion of the researcher. This method is also known as random sampling. There are some techniques that are used in probability sampling they are given below,
- Simple random sampling: Simple random sampling is called a subset of the statistical population where every subset member owns an equal probability. This type of sampling is called an unbiased group representation.
- Multi-stage sampling: Multistage sampling conducts the division of population within clusters of groups for the purpose of doing research. At the time of this sampling, crucial clusters of the picked population are divided into sub-groups at different stages for the purpose of making it easy for collecting the primary data.
- Cluster sampling: Cluster sampling is known as the probability technique of sampling in which researchers categorize populations within varied clusters or groups for the purpose of research.
- Stratified sampling: A stratified random sampling includes the division of the whole population within homogeneous groups. These groups are known as stratum or strata (plural). This is a random sample from every stratum that is proportional to each cluster. These subsets are clubbed into strata further.
- Optimum allocation stratified sampling: In optimum allocation stratified sampling, the process of allocation is known as optimal. The reason is that survey sampling offers the smallest variation for the calculation of the population. This means that a standard stratified calculator is given with fixed sample size and budget.
- Proportionate sampling: Proportionate sampling is a kind of sampling where the investigator categorises the finite population within subpopulations and then it applies according to the random sample techniques to every subpopulation.
- Disproportionate sampling: Disproportionate sampling is known as an approach for stratified sampling where sample size from each level or stratum is not in the same proportion to the size of a particular level or stratum out of the total population.
All the techniques have been explained thoroughly by Vedantu’s maths teachers. The explanation has been done in the simplest language so that most of the students are able to grasp the concept in a single go. We keep it on the top priority that students do not waste time in searching for the tricky words in the dictionary. Therefore, we always aim to keep it as simple as possible from our end. Now, let’s go through a few of the examples of samples:
Population and Sample Examples
- All the students in the school are the population and the students of class 10 are the sample.
- Patients in the hospital are the population and the old age patients are the sample.
Population and Sample Formula
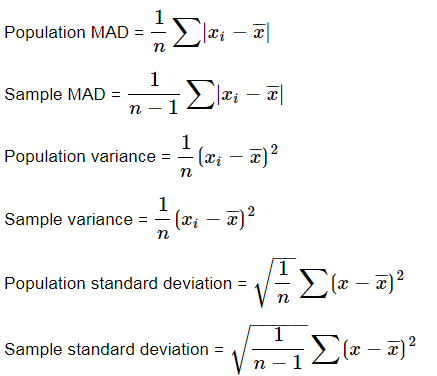
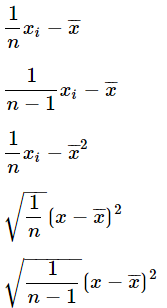
We will discuss some formulas for mean absolute deviation, variance, and standard deviation based on the population and the given sample. Let n be the population size and n-1 be the sample size than the formula for MAD, variance, and standard deviation are given by,

Difference between Population and Sample
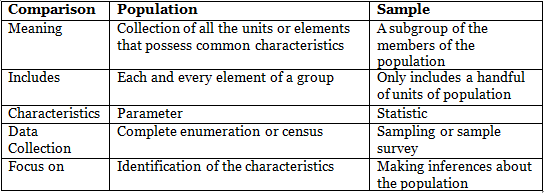
Some of the key differences between population and sample are clearly given below:

|
64 videos|110 docs|63 tests
|


